The 20 Biggest Commodity Reserve Positions in the World
August 23, 2026
Australian uranium: the world's largest reserves, and no nuclear power at home
Australia holds about 35% of the world's known uranium, by the IAEA and NEA's 2019 estimate. Olympic Dam, found in 1975 under a pastoral station, is the largest known uranium deposit, and Australia is the third-largest producer after Kazakhstan and Canada, exporting to Europe, Asia and the Americas. Politics has shaped the industry: a three-mines policy from 1984 to 1996, the Ranger mine surrounded by Kakadu National Park for 39 years until it closed in 2021, and nuclear power plants banned under the ARPANS Act of 1998 and the EPBC Act of 1999. Australia's only reactor, at Lucas Heights, makes medical isotopes rather than power; the country is acquiring nuclear submarines, but the opposition that proposed nuclear plants lost the 2025 election, and coal and gas still generate most of its electricity. Australia has the fuel of the nuclear age and sells it to everyone else.
Production tells you who supplies the world this year. Reserves tell you who can. This is a ranking of the twenty largest single-country reserve positions in world commodities, calculated from the USGS Mineral Commodity Summaries published February 2026, with August 2026 prices attached. Two findings stand out. Australia appears seven times and leads production in only one of them — it is the largest under-exploited resource base on earth. And Australia’s numbers carry a reporting asterisk severe enough that its real position is probably closer to half of what the table shows.
🎯 Key Takeaways
- South Africa’s 82.9% of world PGM reserves is the largest single-country position in any major commodity.
- Australia holds seven of the top twenty reserve positions — vanadium, lead, ilmenite, manganese, iron ore, uranium and zinc — and is a minor producer of six of them. Its vanadium output is literally zero.
- Reserve rank and production rank diverge for 14 of the 20. Holding the ore is not the same as selling it.
- USGS tabulates Australia on an economic-demonstrated-resources basis, not JORC. Where both are published the gap is roughly half: gold 13,000 t versus 4,500 t, iron ore 59 Gt versus 24 Gt.
- Several “reserve” figures are not comparable at all — Venezuela’s oil, China’s coal, and any total the USGS prints with a “greater than” sign.
Reserves are the least understood number in commodities. They are quoted as though they were a geological fact, when they are an economic judgement: the portion of an identified resource that could be extracted profitably under the conditions prevailing when the assessment was made. Prices rise and reserves grow without a metre of new drilling. A permitting regime tightens and they shrink.
Read with that in mind, the reserve table says something the production table cannot. Production is a snapshot of the present distribution of industrial capacity. Reserves are a statement about where supply could come from if the price justified building it.
The twenty largest reserve positions
| # | Country | Resource | % world reserves | % world production | Price per tonne, Aug 2026 |
|---|---|---|---|---|---|
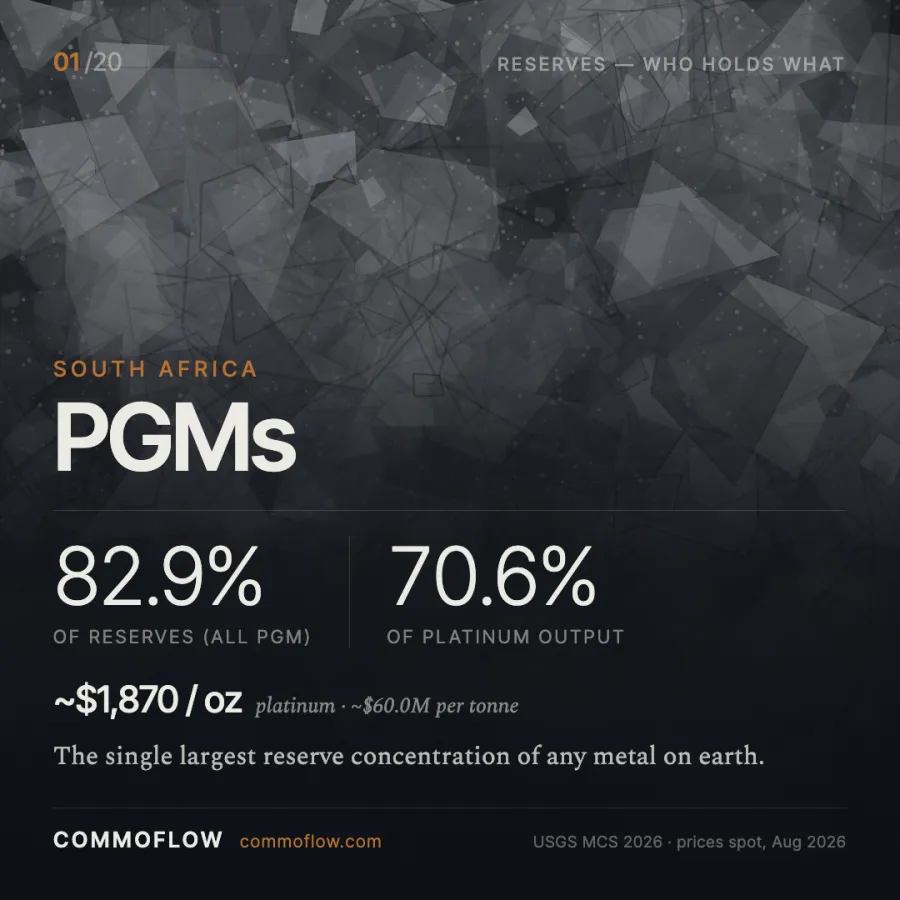
| 1 | South Africa | PGMs | 82.9% | 70.6% (Pt) | ~$59.1m (Pt) |
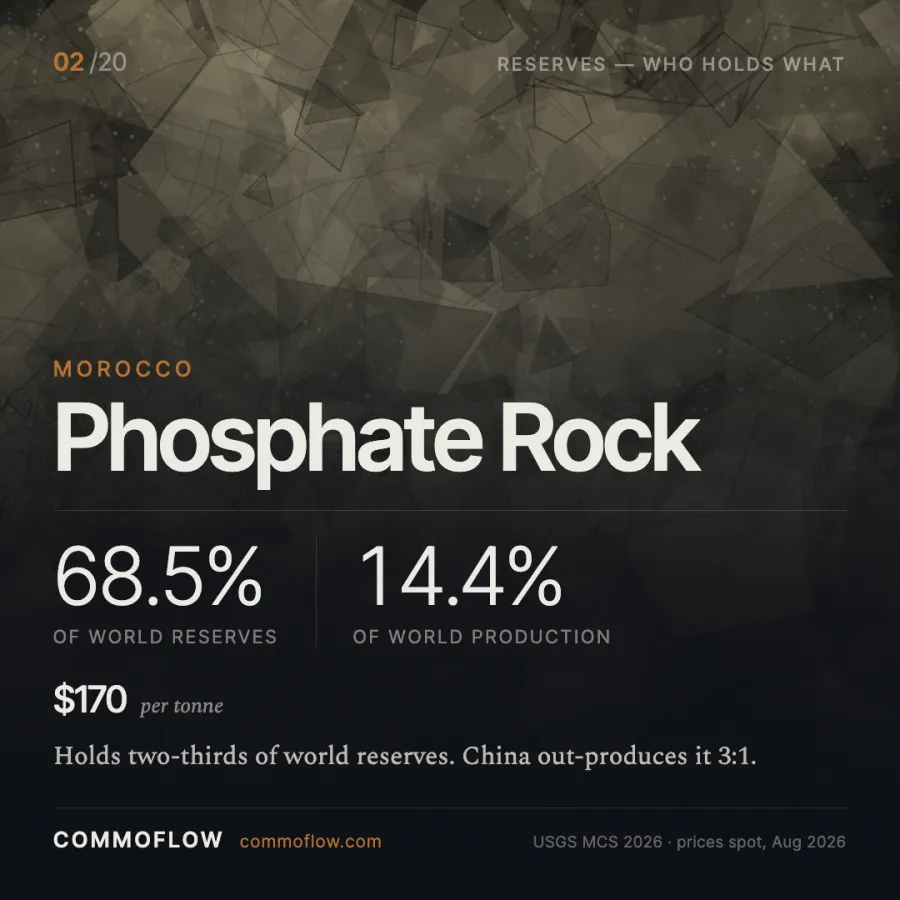
| 2 | Morocco | Phosphate rock | 68.5% | 14.4% | $170 |
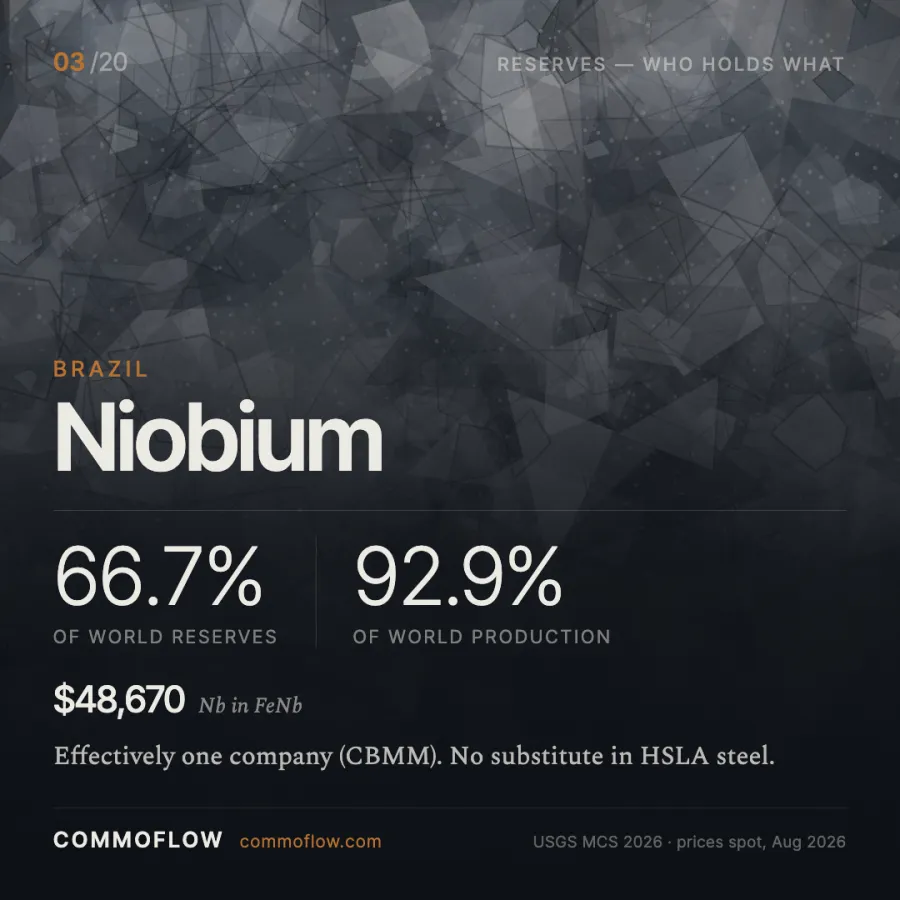
| 3 | Brazil | Niobium | 66.7% | 92.9% | $48,670 |
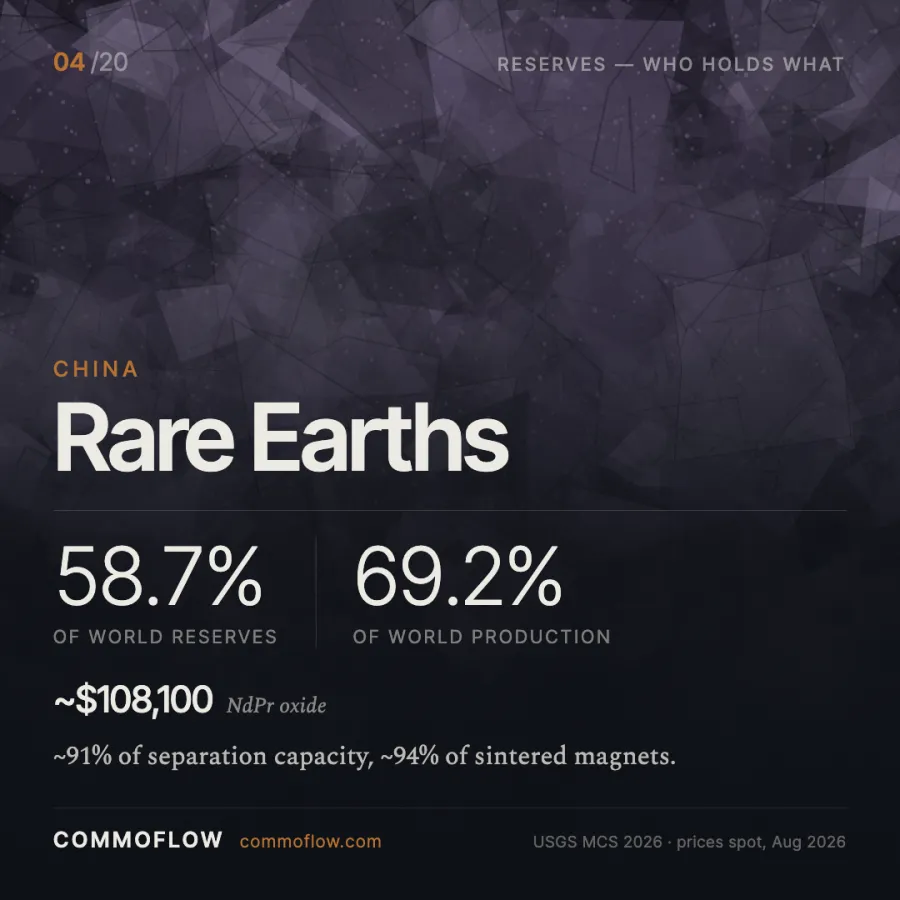
| 4 | China | Rare earths | 58.7% | 69.2% | $108,100 (NdPr ox., China) |
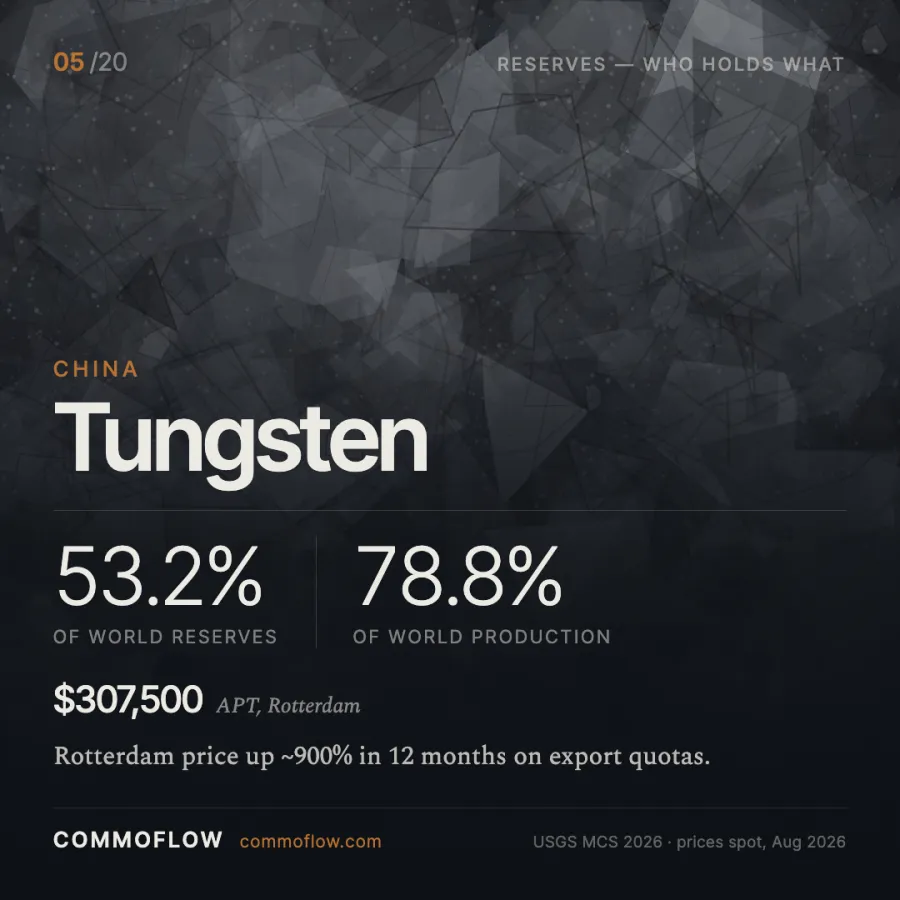
| 5 | China | Tungsten | 53.2% | 78.8% | $307,500 (APT) |
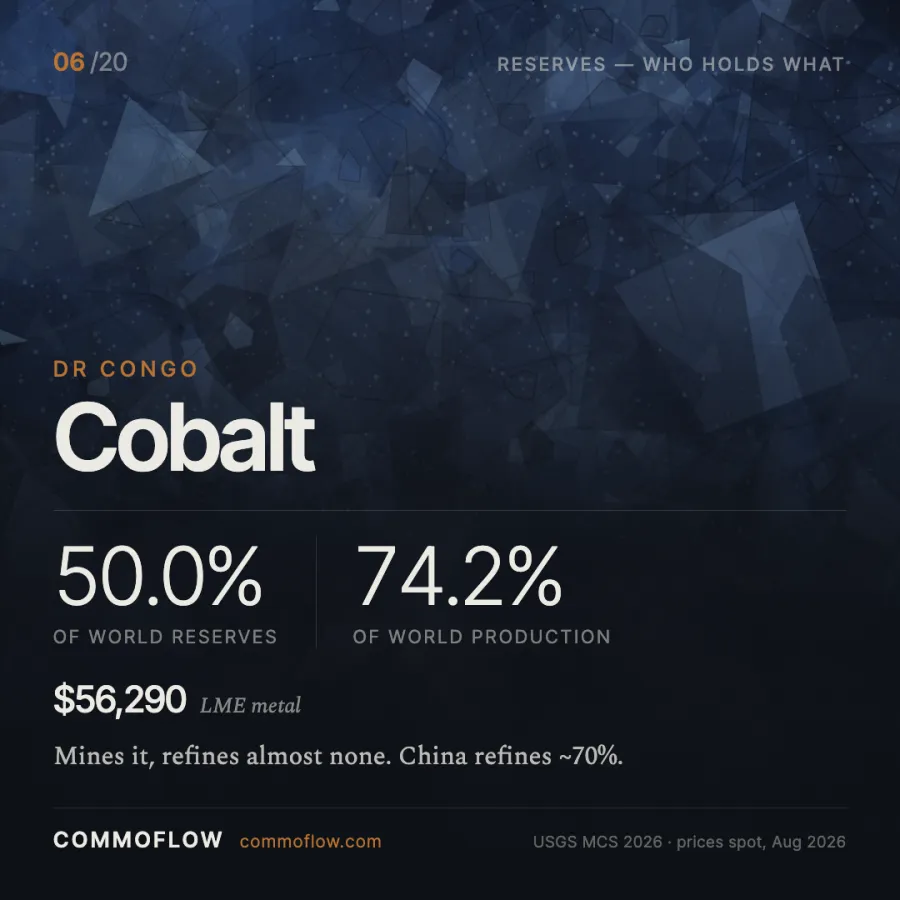
| 6 | DR Congo | Cobalt | 50.0% | 74.2% | $56,290 |
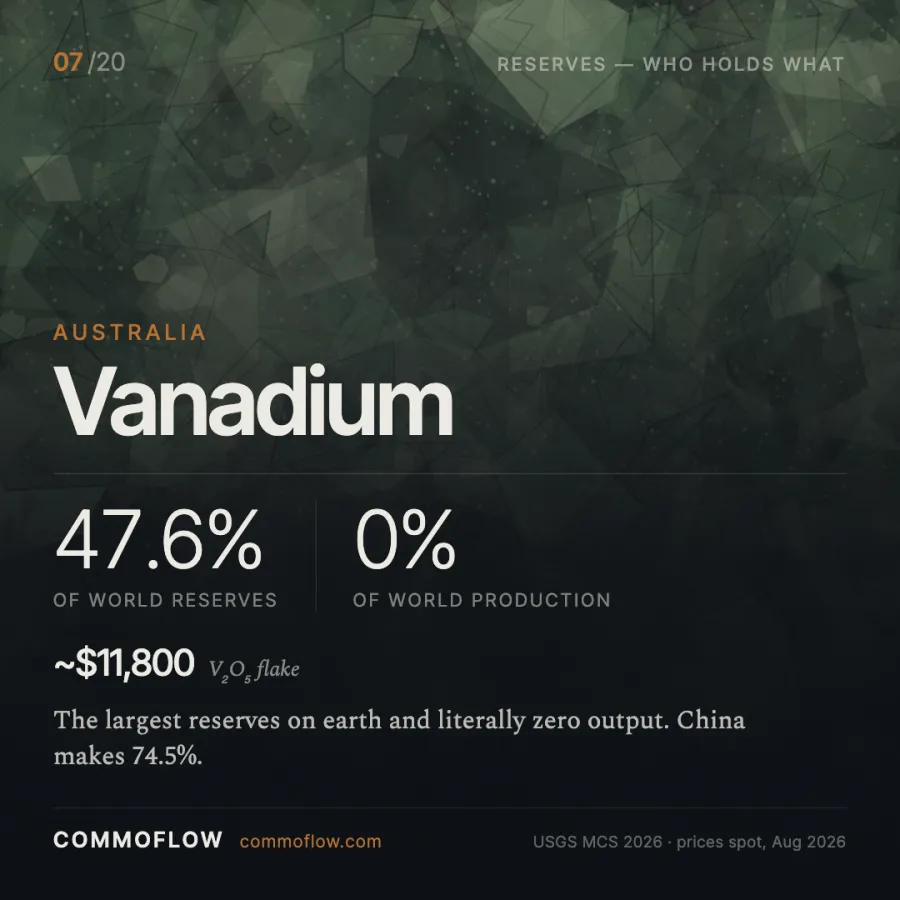
| 7 | Australia | Vanadium | 47.6% | 0% | ~$11,800 |
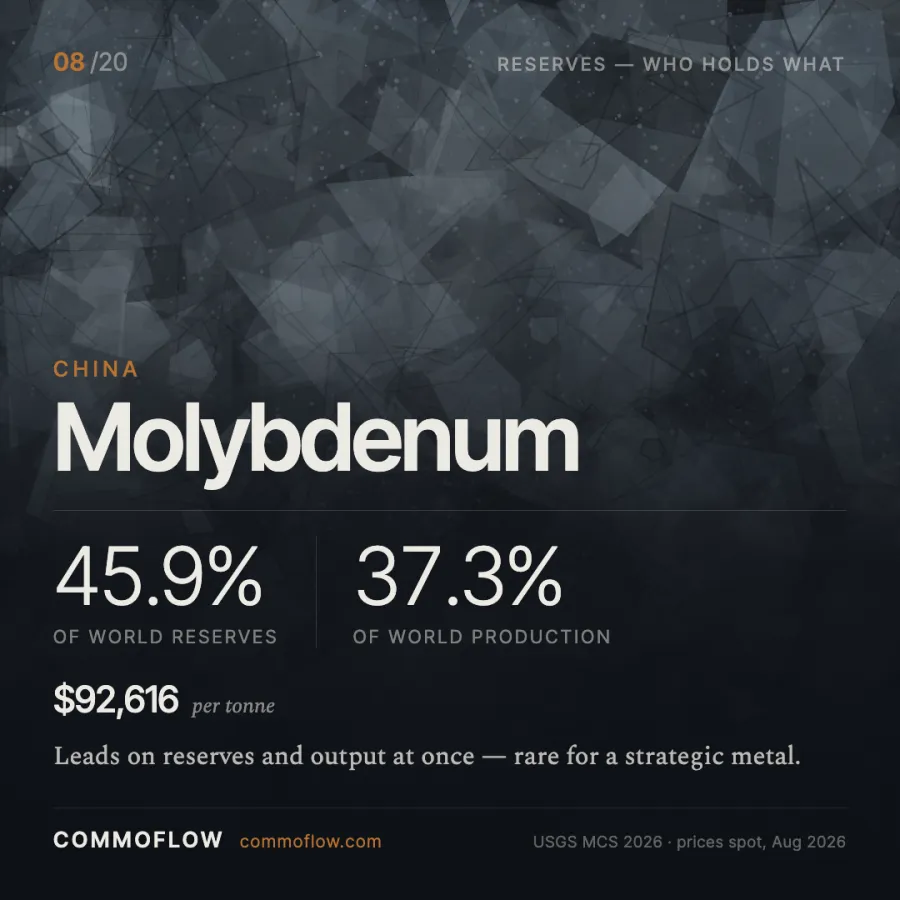
| 8 | China | Molybdenum | 45.9% | 37.3% | $92,616 |
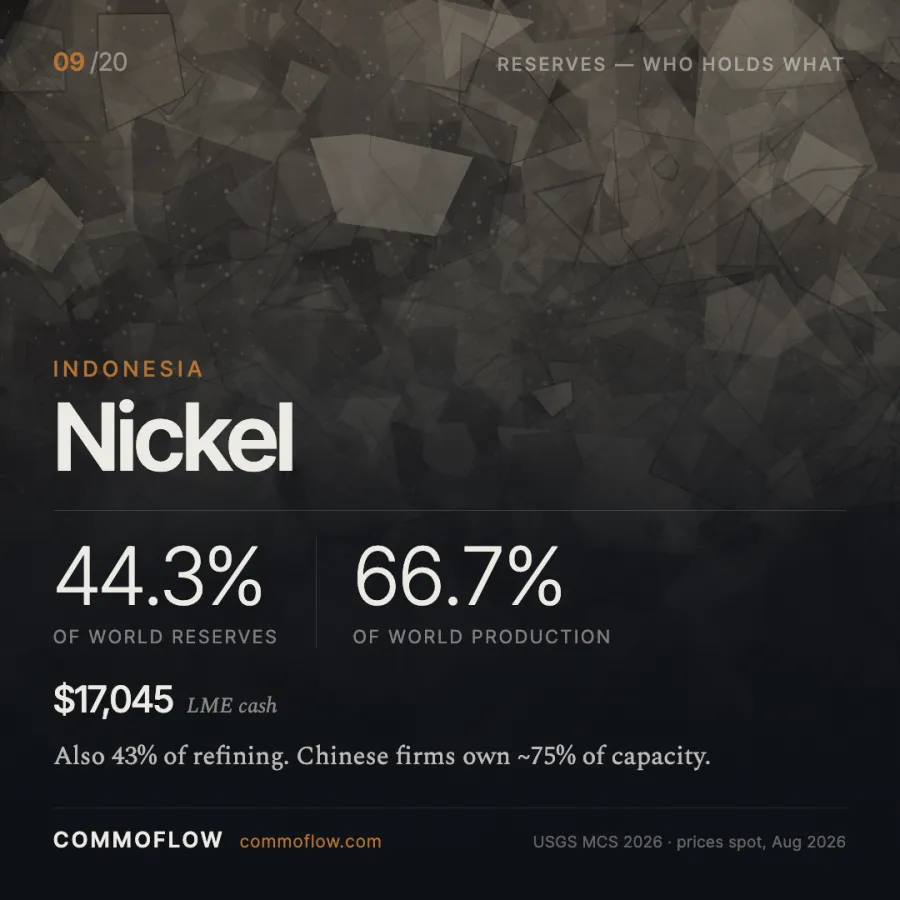
| 9 | Indonesia | Nickel | 44.3% | 66.7% | $17,045 |
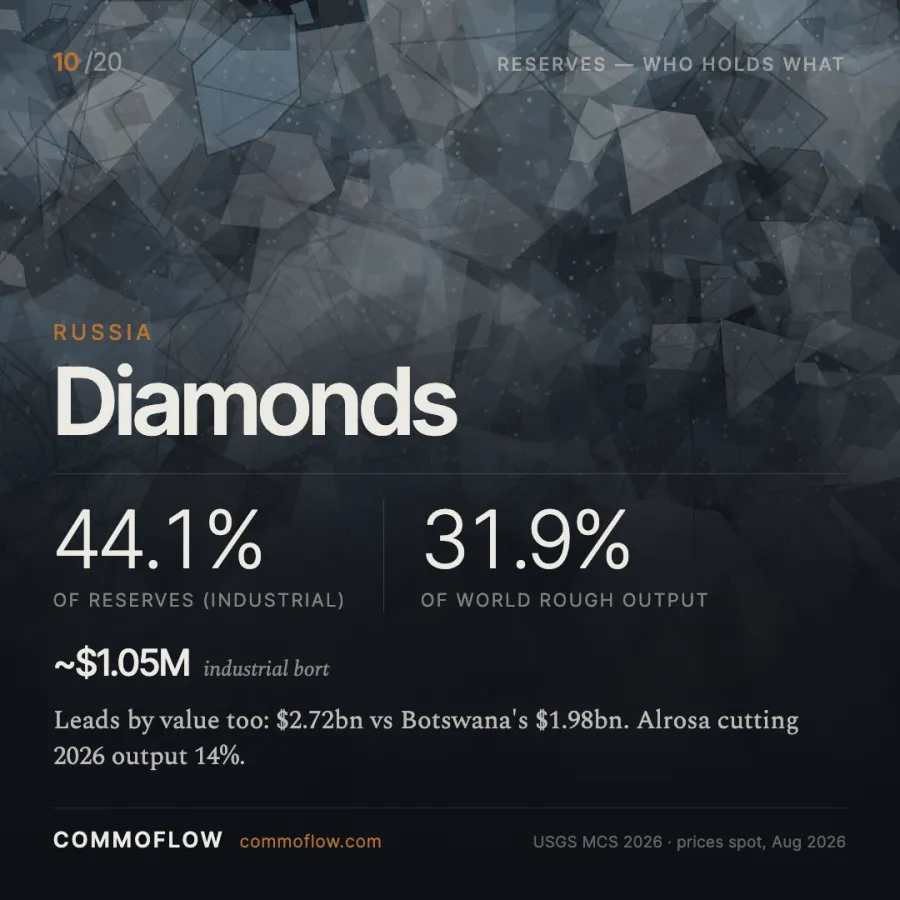
| 10 | Russia | Diamonds | 44.1% (industrial) | 31.9% (all rough) | ~$1.05m (bort) |
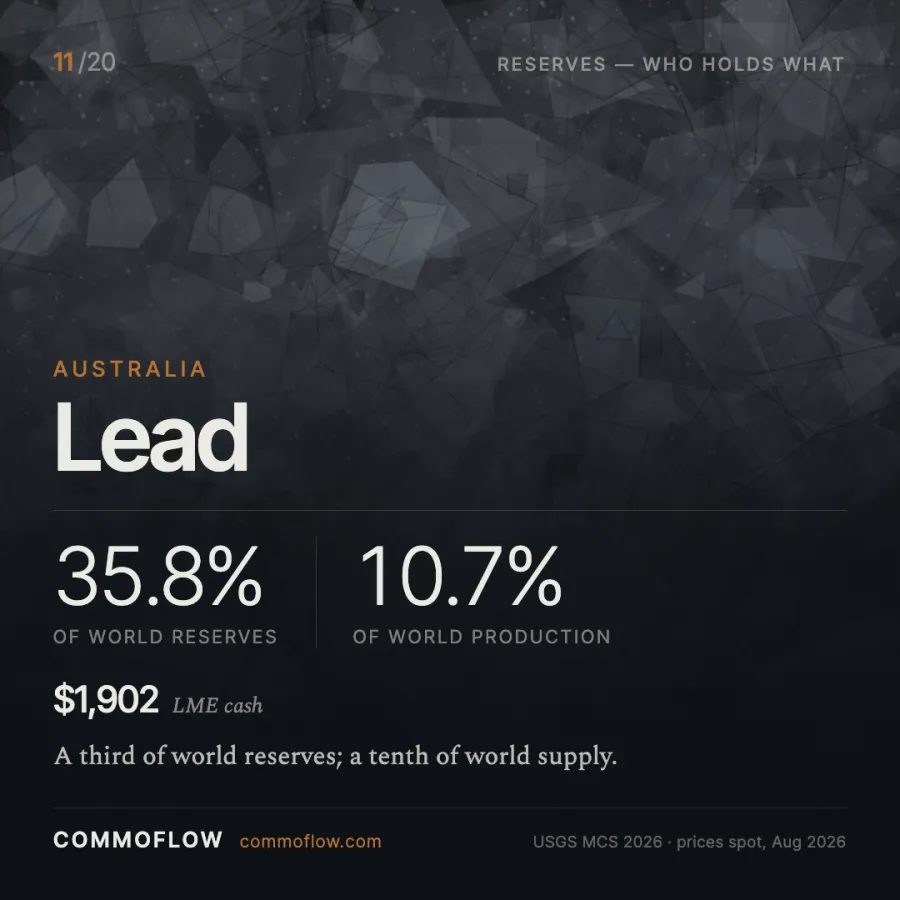
| 11 | Australia | Lead | 35.8% | 10.7% | $1,902 |
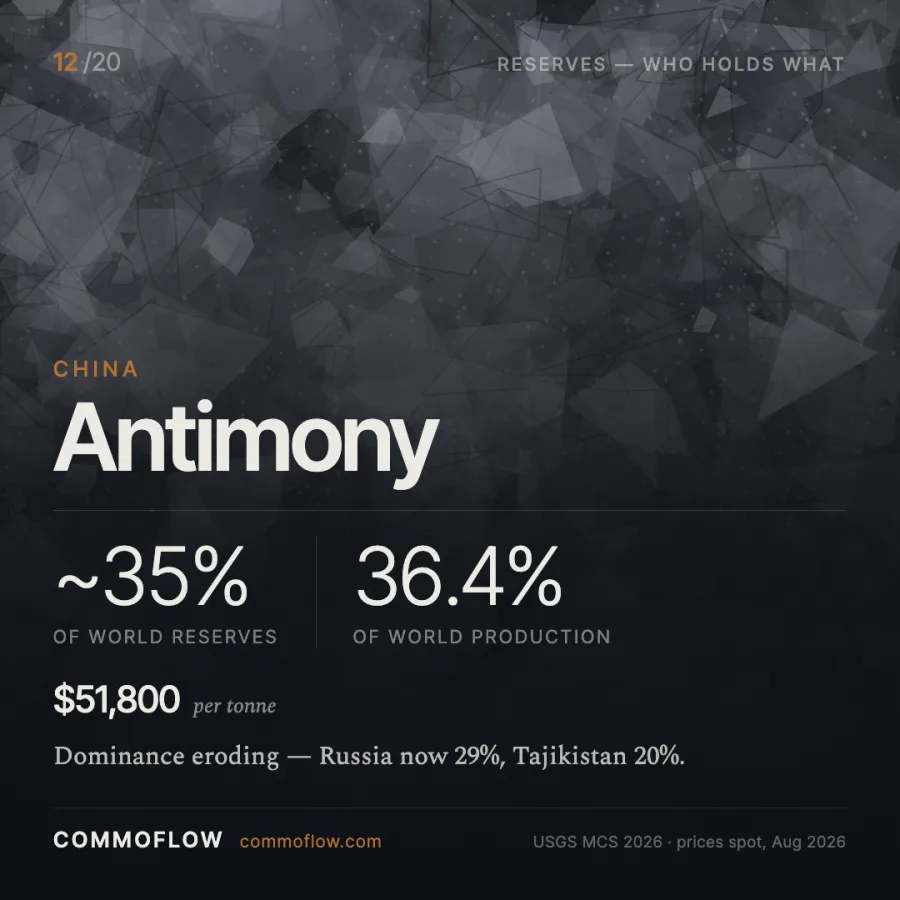
| 12 | China | Antimony | ~35% | 36.4% | $51,800 |
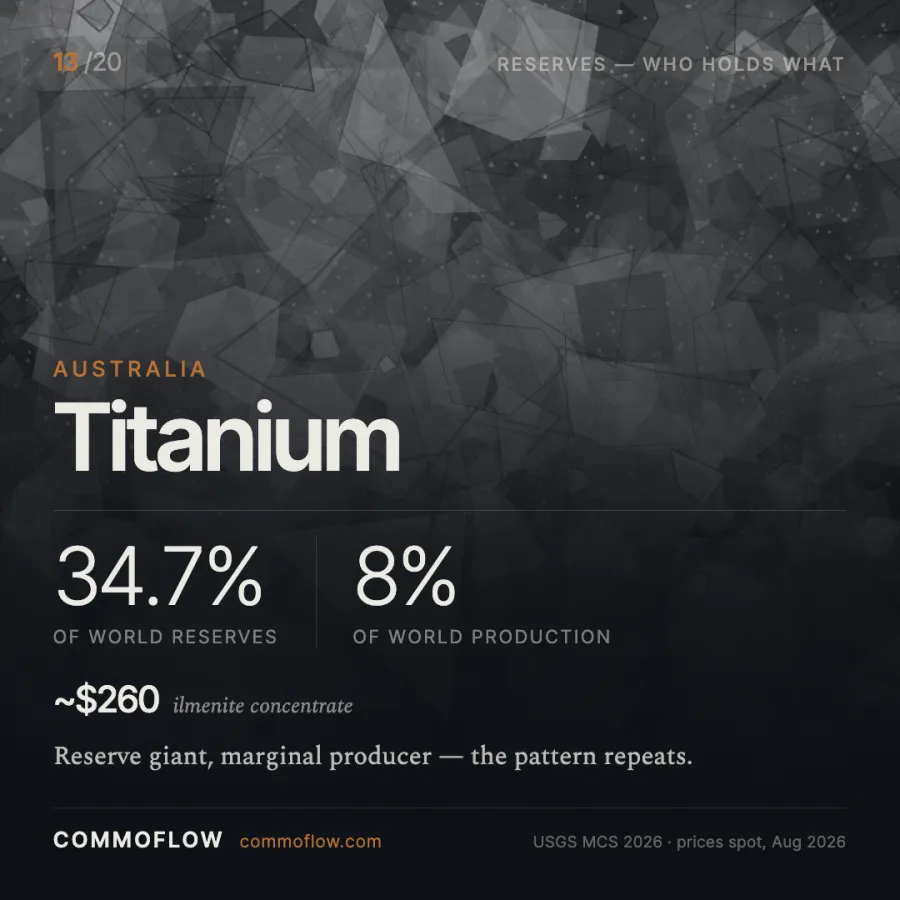
| 13 | Australia | Titanium (ilmenite) | 34.7% | 8.3% | ~$260 (concentrate) |
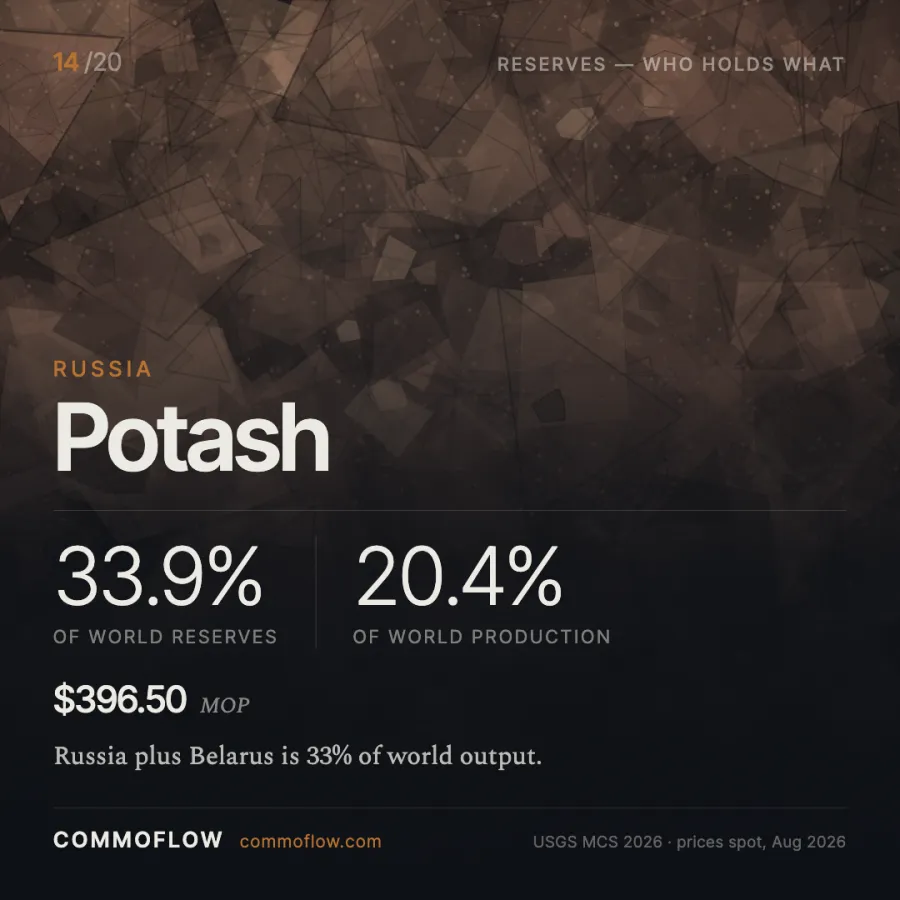
| 14 | Russia | Potash | 33.9% | 20.4% | $396.50 (MOP) |
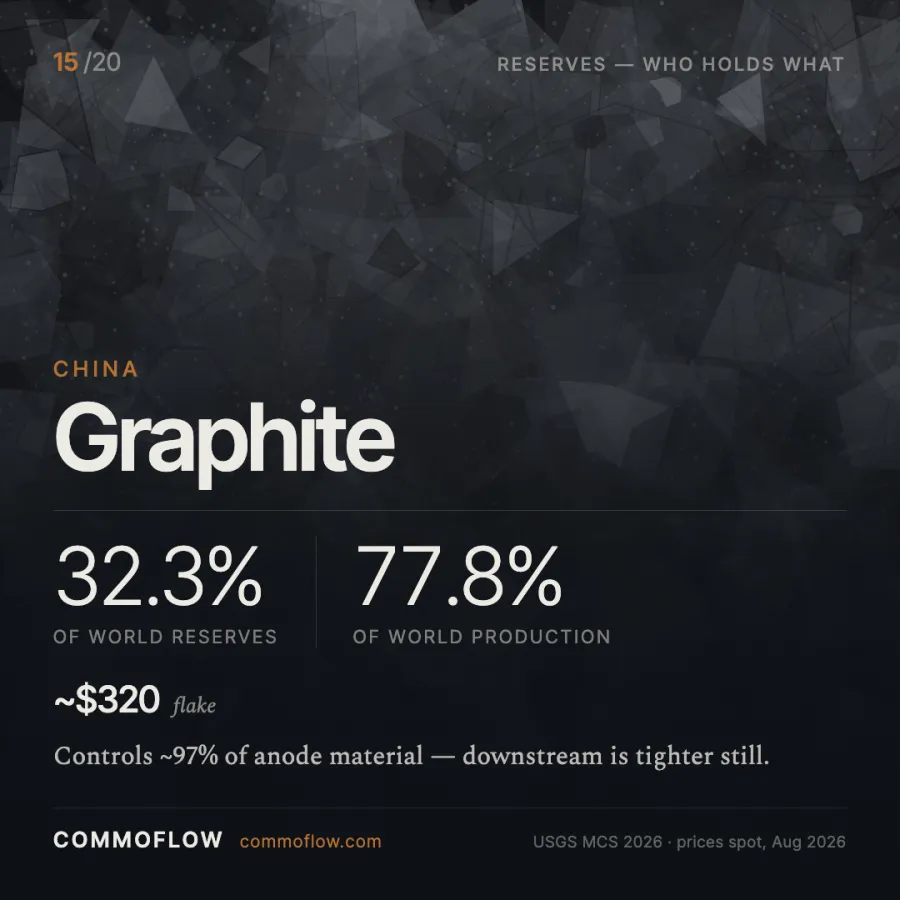
| 15 | China | Graphite | 32.3% | 77.8% | ~$320 (flake) |
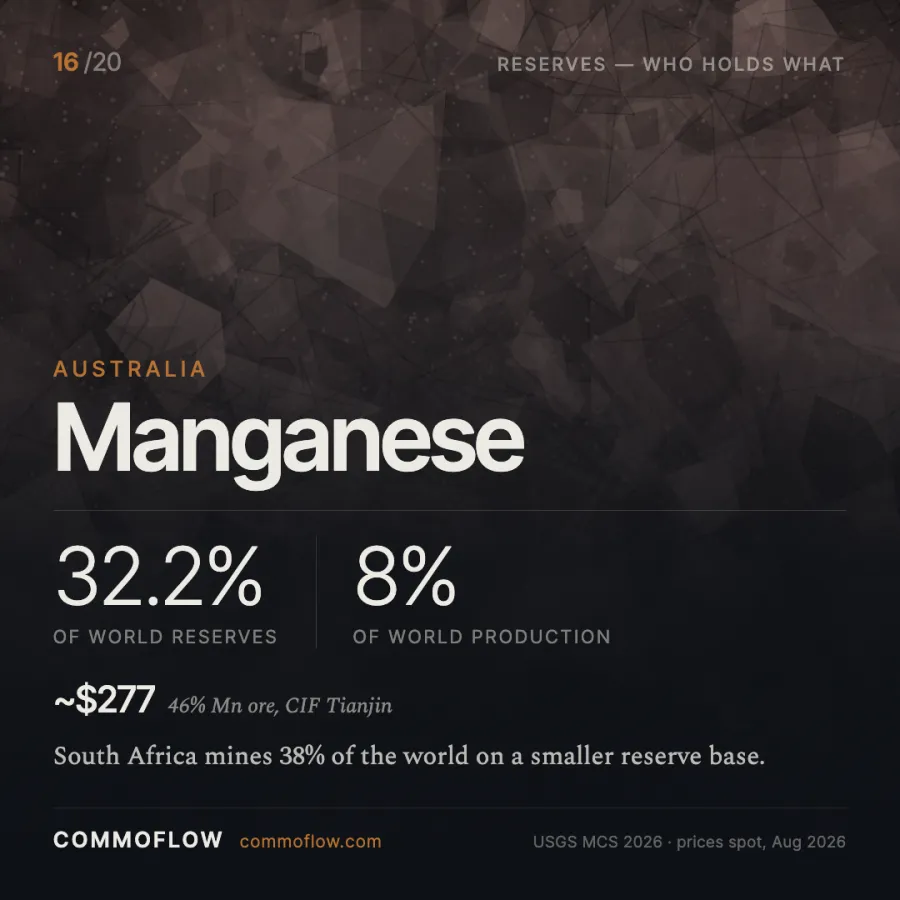
| 16 | Australia | Manganese | 32.2% | 8.0% | ~$277 (ore) |
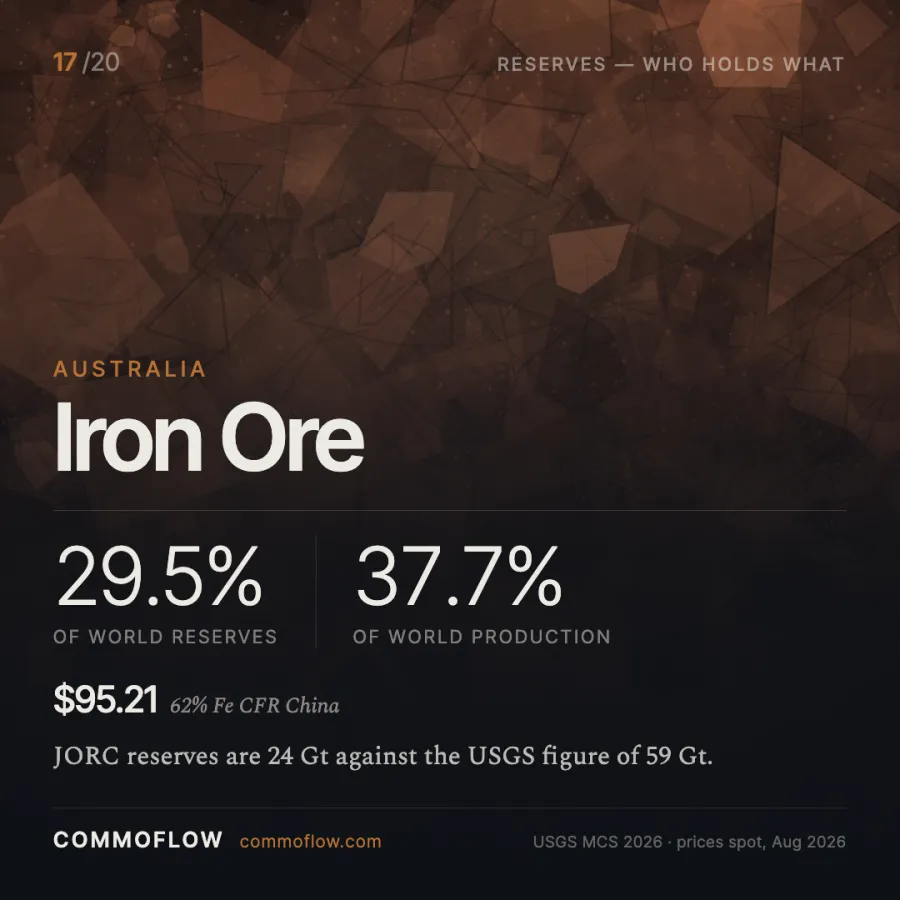
| 17 | Australia | Iron ore | 29.5% | 37.7% | $95.21 |
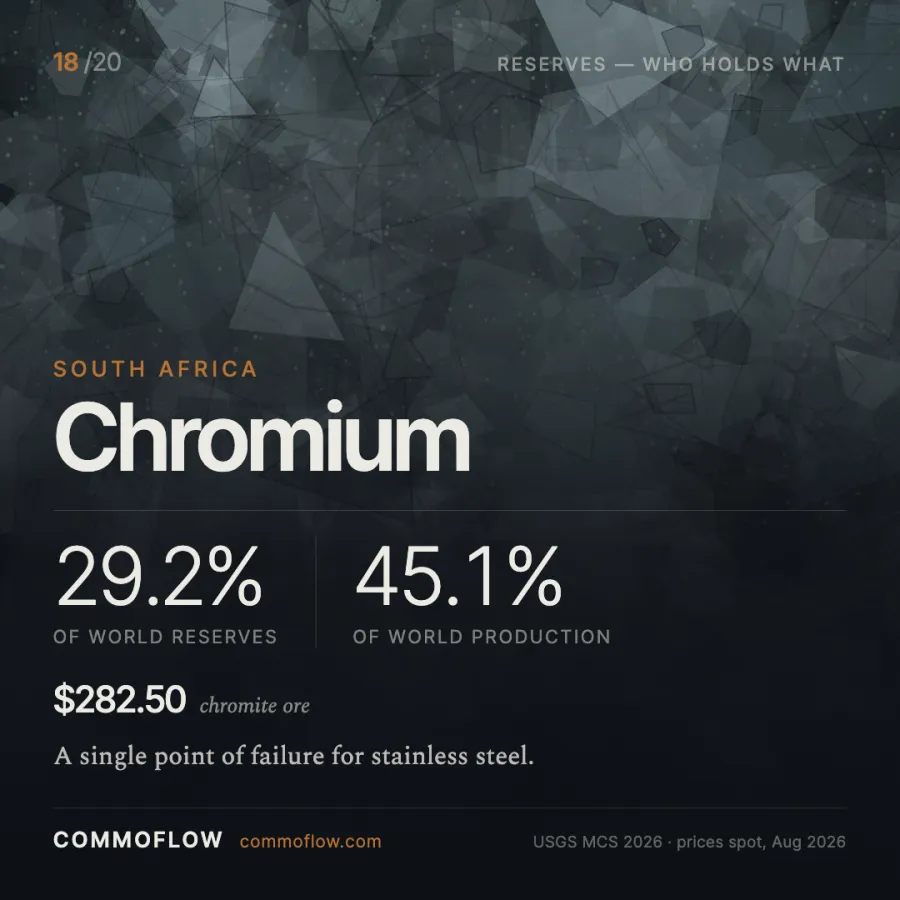
| 18 | South Africa | Chromium | 29.2% (ore) | 45.1% | $282.50 (ore) |
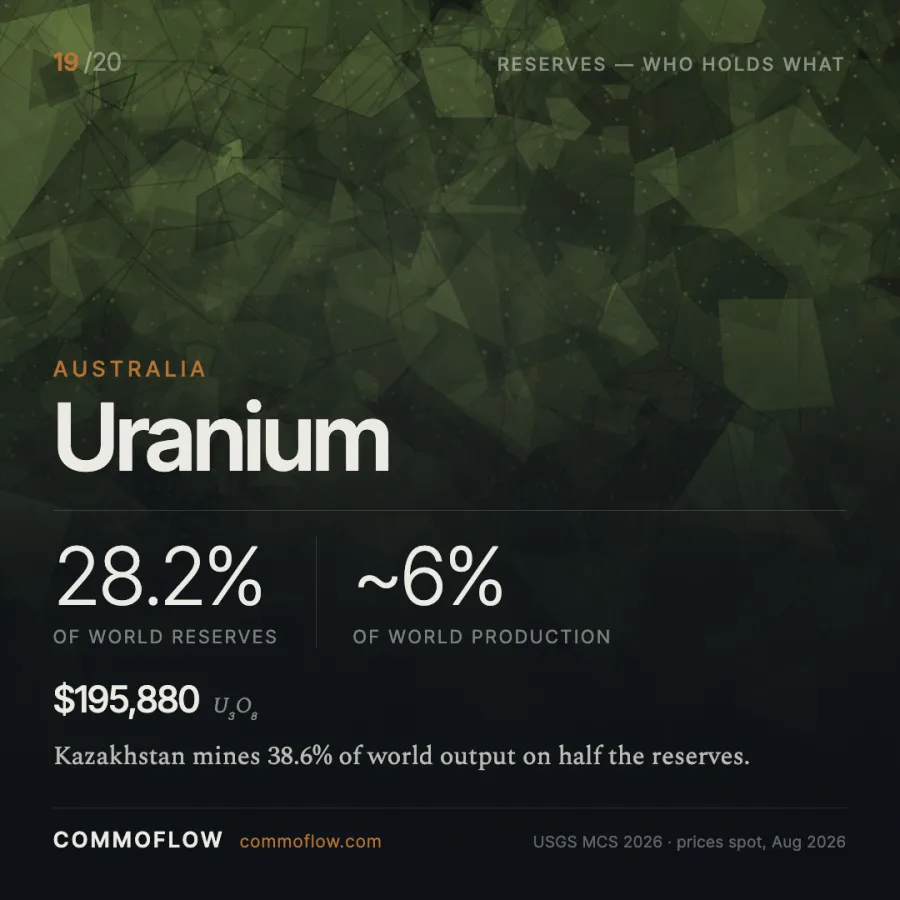
| 19 | Australia | Uranium | 28.2% | ~6% | $194,666 (U₃O₈) |
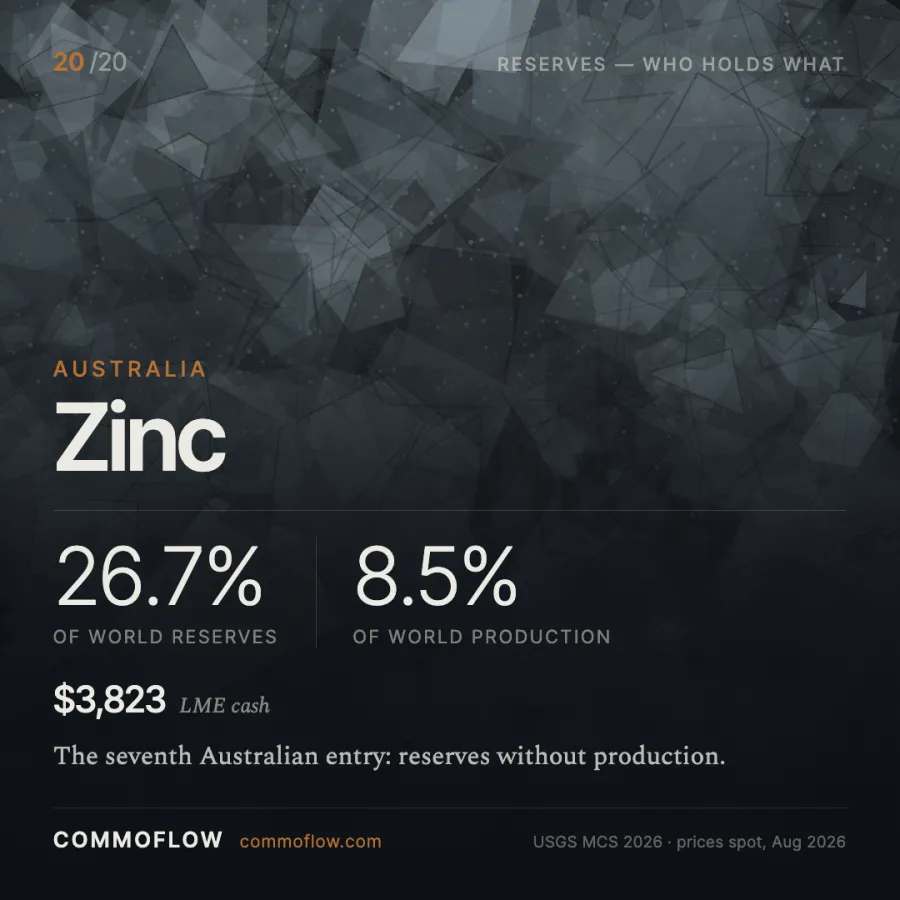
| 20 | Australia | Zinc | 26.7% | 8.5% | $3,823 |
All reserve and production shares are calculated from the USGS Mineral Commodity Summaries 2026, which carries estimated 2025 production. Prices are benchmark or spot assessments from the week ending 21 August 2026.
Just below the line
Nine more positions sit between 18% and 26%, and several are more commercially important than the ones above them.
| Country | Resource | % world reserves | % world production |
|---|---|---|---|
| Guinea | Bauxite | 25.5% | 34.1% |
| Chile | Lithium | 24.9% | 31.7% (Australia leads) |
| Indonesia | Tin | 23.3% | 24.5% (China leads) |
| United States | Coal | 21.3% | ~53% (China leads) |
| Russia | Natural gas | 19.8% | ~25% (US leads) |
| Australia | Gold | 19.7% | 11.5% (China leads) |
| Venezuela | Crude oil | 19.3% | 16.1% (US leads) |
| Chile | Copper | 18.4% | 23.0% |
| Peru | Silver | 18.0% | 24.2% (Mexico leads) |
The Australia anomaly
Australia appears seven times in the top twenty. It leads world production in exactly one of those seven — iron ore. It holds the world’s largest reserves of vanadium and produces none at all. It holds 32.2% of manganese reserves and produces 8.0%. It holds 34.7% of ilmenite reserves and produces 8.3%. It holds 28.2% of uranium reserves and produces roughly 6%.
A large reserve base with small production is either an opportunity or a warning, and the distinction is everything. It depends on why the deposit has not been developed — capital cost, distance to port, permitting, native title process, grade, or the simple fact that someone else can produce the same tonne cheaper.
For Australian vanadium the answer is mostly cost and processing complexity: the resource sits in titaniferous magnetite that is expensive to treat, and China produces the same units from steel-slag by-product at a lower marginal cost. For uranium it is largely policy — state-level restrictions have kept most of the resource undeveloped for decades. For manganese and ilmenite it is a mixture of grade, freight and the fact that South Africa and China respectively got there first at scale.
The asterisk on every Australian row
There is a reporting problem underneath these numbers that no other country in the table shares to the same degree.
The USGS tabulates Australian reserves on a broad economic-demonstrated-resources basis rather than a JORC-compliant one. JORC — the Australasian Code for Reporting of Exploration Results, Mineral Resources and Ore Reserves — is the standard any listed company must use, and it is considerably stricter. Where both figures are published, the gap is severe:
- Gold: 13,000 t on the USGS basis, 4,500 t JORC-compliant. That moves Australia from 19.7% of world reserves to 6.8%.
- Iron ore: 59 Gt on the USGS basis, roughly 24 Gt JORC-compliant.
- Lithium: USGS reports 8.4 Mt, with a footnote stating JORC-compliant or equivalent reserves of 5.1 Mt.
Applied consistently, that correction would cut Australia’s position across this table by something close to half. The USGS footnotes it honestly — the lithium chapter states the JORC figure explicitly — but the headline number is what gets quoted. No other country in the top twenty carries a distortion this large in the same direction.
Reserve figures you should not trust at face value
⚠️ Where the definitions break down
- Venezuela’s crude oil. 303.7 Gbbl of proven reserves, 19.3% of the world total, is the largest oil position on earth on paper. It counts Orinoco extra-heavy crude requiring upgrading before it is saleable. Independent estimates of economically recoverable volume run near 29 Gbbl — about a tenth of the stated figure.
- China’s coal. Chinese reserve reporting uses domestic categories that are not equivalent to the internationally used definitions, and revisions have historically been large and unexplained.
- Anything with a “greater than” sign. USGS reports world rare earth reserves as >75,000,000 t, antimony as >2,000,000 t, tin as >6,000,000 t and PGMs as >76,000,000 kg. Every percentage share computed against those totals is an upper bound, not a value. China’s antimony share is at most 41.5% and probably meaningfully less.
- Resources are not reserves. Bolivia is routinely described as holding the world’s largest lithium endowment. It holds roughly 23 million tonnes of resources and zero USGS-tabulated reserves, because nothing there has yet been shown to be economically extractable at scale.
- Industrial diamond is a subset. The USGS world total of 38 million carats covers natural industrial stones only. Russia’s 44.1% is a share of that subset; against all natural rough production its share is 31.9%, on Kimberley Process 2025 data.
- Units matter more than they appear to. Lithium is tabulated as contained lithium, not carbonate equivalent — multiply by 5.323 to compare with an LCE price. Chromium reserves can be quoted as ore or as Cr₂O₃ content, and South Africa’s share changes from 29.2% to 20.4% depending on which you pick.
What the reserve table says that the production table does not
Concentration is more durable than it looks. Where a country leads both reserves and production — South Africa in PGMs, Brazil in niobium, China in tungsten and rare earths, the DRC in cobalt — the position is structural. There is no near-term substitute origin, because the geology is not there to be found elsewhere at grade.
Where reserves and production diverge, supply can move. China holds only 32.3% of graphite reserves while producing 77.8%. That is a processing and cost position, not a geological one, and it is already eroding: Mozambique and Tanzania roughly doubled output in 2025. The same logic applies in reverse to Australian vanadium — the resource exists, the economics do not yet.
Reserve leadership without production is a standing question, not an asset. Seven Australian entries in a top-twenty table look impressive until you notice the production column. The interesting work in commodities is usually figuring out which of those gaps is a cost problem, which is a permitting problem, and which is a grade problem that will never close.
CommoFlow works across most of these materials, including the mine acquisition and joint-venture side where these questions get answered with drill data rather than tables. If you are assessing an asset or a supply route, talk to our desk, or read more on mining investment and mine acquisition.
Frequently asked questions
Which country has the most mineral reserves in the world?
No single country leads overall, because reserves are counted commodity by commodity in different units. By number of top-twenty positions, Australia leads with seven, followed by China with five. By the size of any individual position, South Africa’s 82.9% of world platinum-group metal reserves is the largest.
Why does Australia hold so many reserves but produce so little?
A mixture of cost, distance to market, permitting and grade, varying by commodity. Australian vanadium sits in titaniferous magnetite that is expensive to process, while China produces the same units cheaply as a steel-slag by-product. Australian uranium is largely constrained by state-level policy rather than geology.
Are USGS reserve figures comparable between countries?
Not strictly. The USGS compiles from national and company sources that use different reporting codes. Australia is tabulated on an economic-demonstrated-resources basis rather than JORC, which roughly doubles its apparent position; where both are published, Australian gold reserves are 13,000 t USGS versus 4,500 t JORC.
What is the difference between reserves and resources?
Reserves are the portion of an identified resource that could be economically extracted at the time of assessment. Resources include everything identified regardless of economics. Bolivia holds about 23 million tonnes of lithium resources and zero tabulated reserves — the standard illustration of why the two words are not interchangeable.
Sources
- USGS Mineral Commodity Summaries 2026 — reserves and 2025 estimated production, published 6 February 2026
- OPEC Annual Statistical Bulletin 2026 — proven crude oil reserves at end-2025
- Kimberley Process 2025 — total rough diamond production by country and value
- Westmetall / LME cash settlements — base metal prices, 21 August 2026
- Shanghai Metals Market, Fastmarkets and Benchmark Mineral Intelligence — battery and minor metal assessments
- World Bank Pink Sheet, August 2026 — bulk commodity benchmarks
Have a commodity requirement? Get in touch.