Who Produces the World's Raw Materials in 2026
August 23, 2026
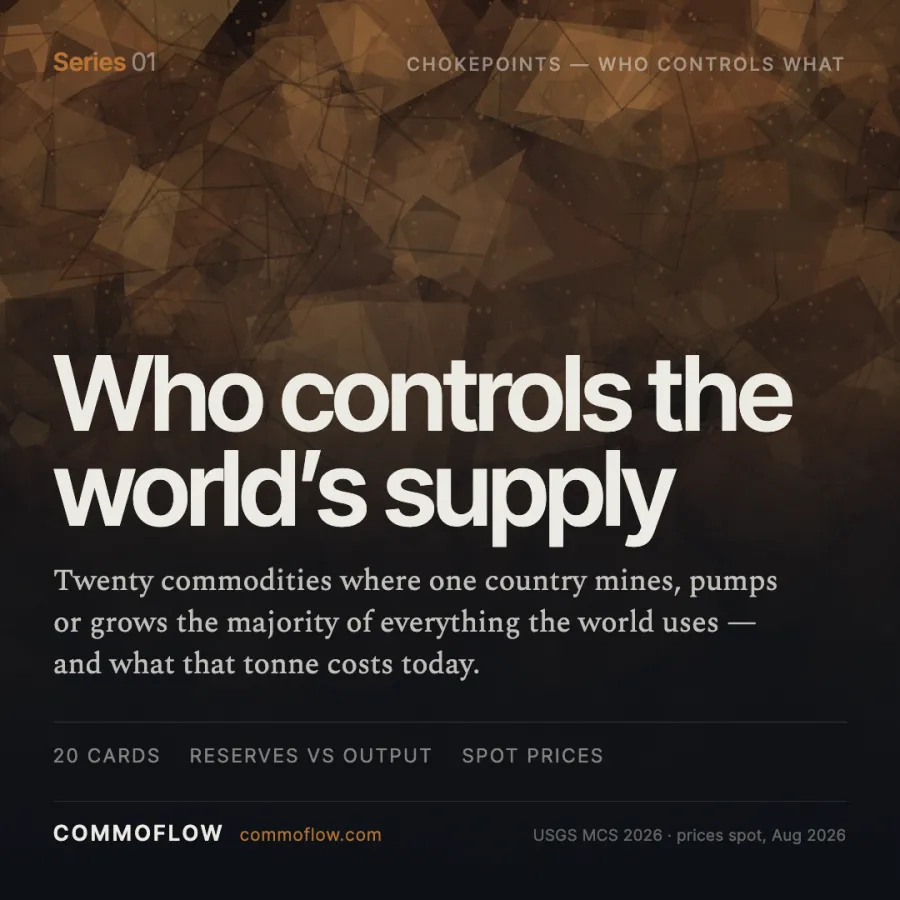
This is a country-by-country map of who actually produces the world’s raw materials, covering 31 commodities across energy, base metals, precious metals, battery inputs and fertilizer feedstocks. Every reserve and production share is calculated from the USGS Mineral Commodity Summaries published in February 2026, and every price was taken from the market in the week of 17–21 August 2026 and converted to a common basis of US dollars per metric tonne. The pattern that emerges is not the one most supply-chain conversations assume: for a large group of materials, the country that digs the ore and the country that controls the processed product are different countries entirely.
🎯 Key Takeaways
- China leads world production of 13 of the 31 commodities here — and leads refining in several more where it mines almost nothing.
- The sharpest split is cobalt: the DR Congo mines 74.2% of it, China refines the majority. Neither number alone describes the risk.
- Four positions exceed two-thirds of world output from a single country: niobium (Brazil, 92.9%), tungsten (China, 78.8%), graphite (China, 77.8%) and cobalt (DR Congo, 74.2%).
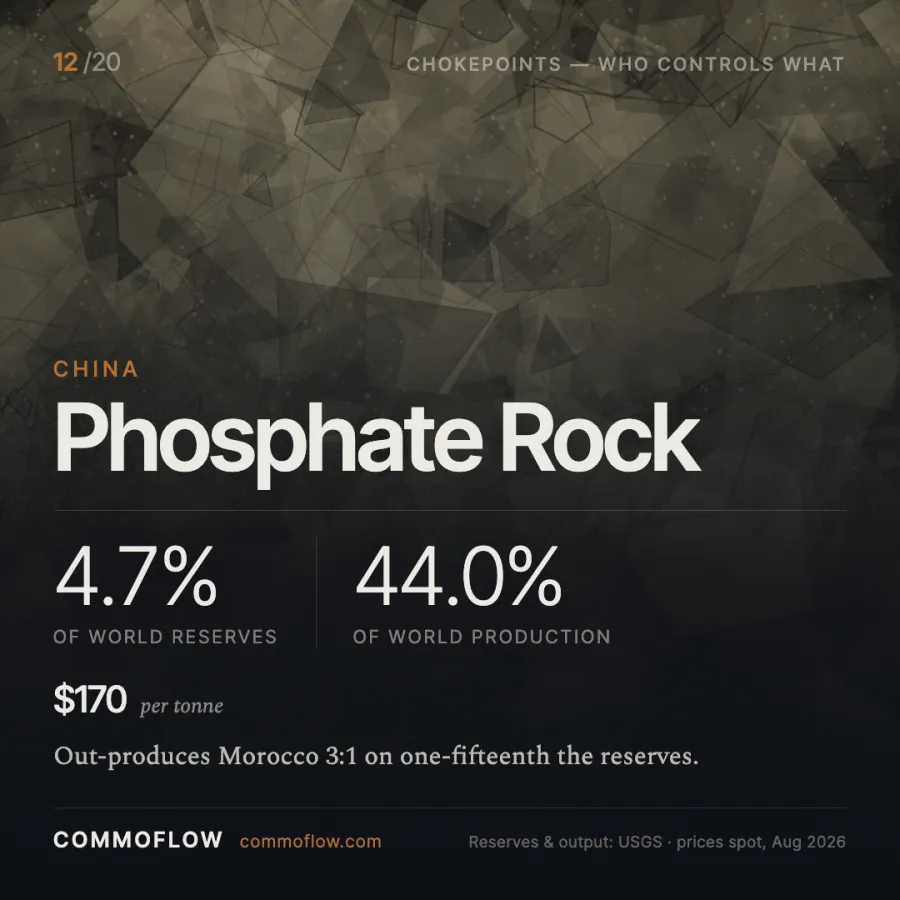
- Prices per tonne span seven orders of magnitude, from phosphate rock at $170 to gold at $147.5 million.
- Reserve leadership and production leadership diverge for 18 of the 27 metals and minerals listed.
Concentration is the defining feature of physical commodity supply, and it is routinely described in the wrong units. A country that holds a third of the world’s reserves of something may produce almost none of it. A country that produces most of the world’s supply may hold almost no reserves. And for the materials that matter most to the energy transition, the mine and the refinery sit on different continents under different flags.
What follows is the current state of that map. All production and reserve figures come from the USGS Mineral Commodity Summaries 2026, released 6 February 2026, which carries estimated 2025 production. Energy reserves come from the OPEC Annual Statistical Bulletin 2026 and the Energy Institute Statistical Review. Prices are spot or benchmark assessments from the week ending 21 August 2026.
Energy: the largest tonnages, the least reliable reserves
| Fuel | Largest producer | % world production | Largest reserves | % world reserves | Price per tonne, Aug 2026 |
|---|---|---|---|---|---|
| Crude oil | United States | 16.1% (13.59 mb/d) | Venezuela | 19.3% | $94.39/bbl → $713/t |
| Natural gas | United States | ~25% | Russia | 19.8% | $2.74/MMBtu → $142/t LNG |
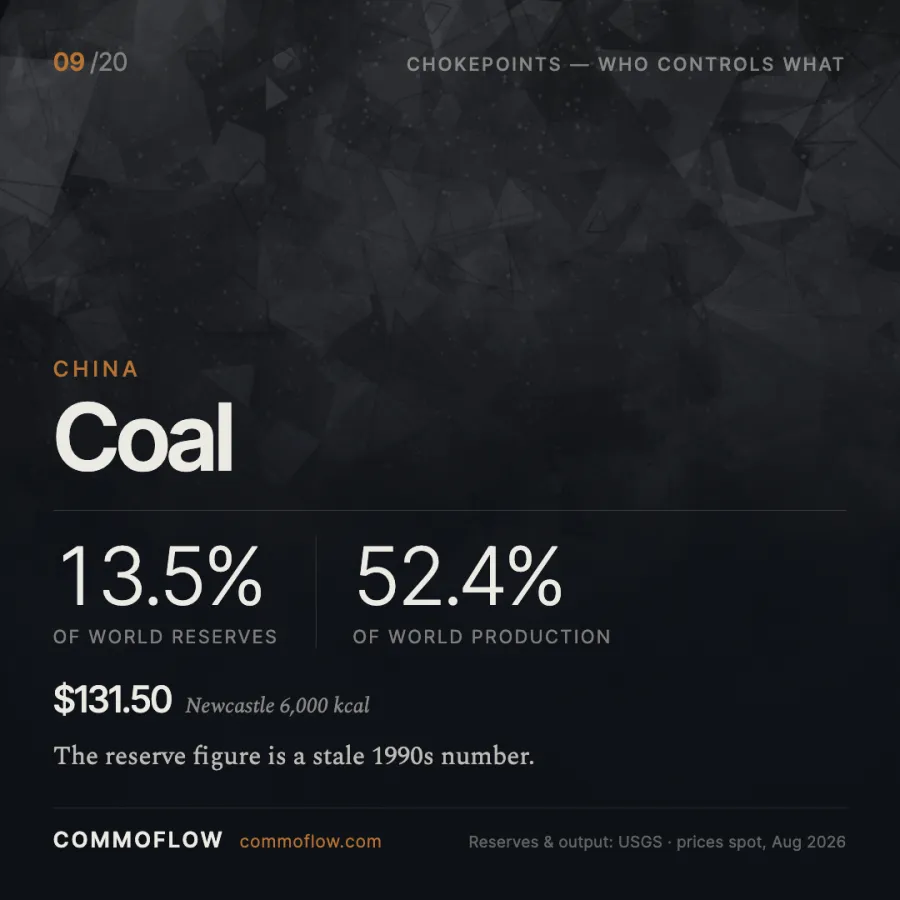
| Thermal coal | China | ~53% | United States | 21.3% | $130.15/t (Newcastle) |
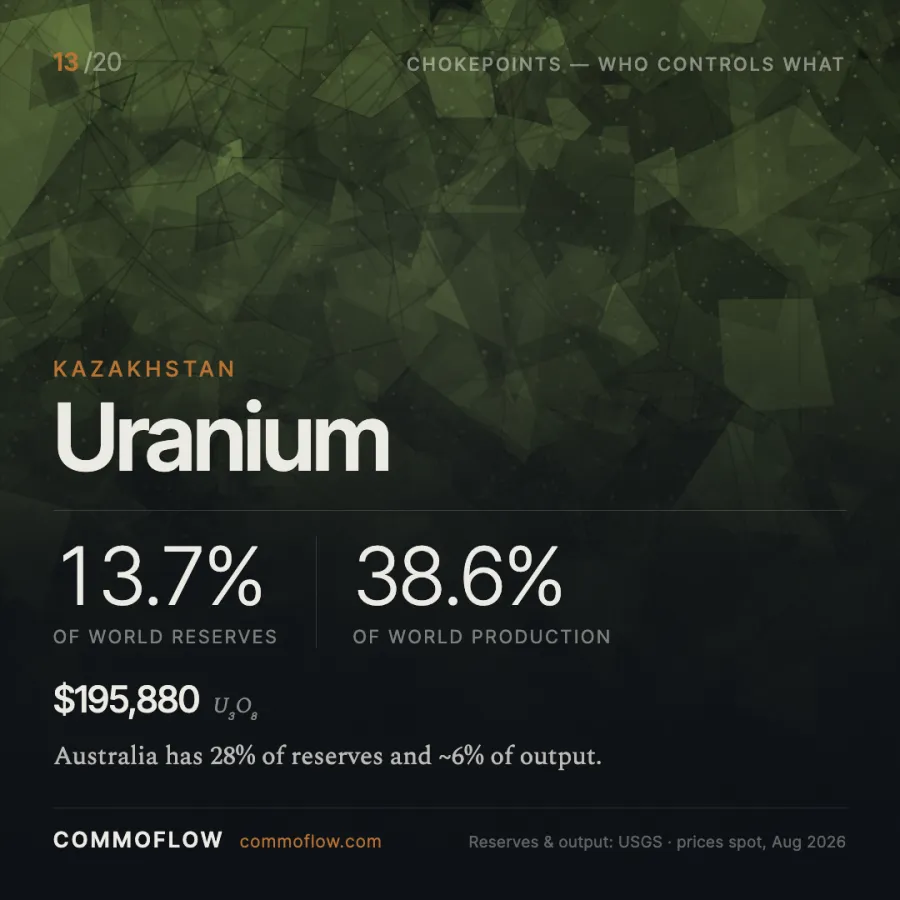
| Uranium | Kazakhstan | ~43% | Australia | 28.2% | $88.29/lb U₃O₈ → $194,666/t |
Energy is where reserve data is least comparable between countries, and the divergence between reserves and production is starkest. The United States produces 16.1% of world crude — more than any other country — while holding roughly 4% of proven reserves. Venezuela holds 19.3% of world proven reserves and produces under 1%.
Brent settled at $94.39/bbl on 21 August 2026. Converting to tonnes depends on the crude: the world-average factor of 7.33 barrels per tonne gives $692/t, but Brent is a lighter crude at roughly 7.55–7.60 bbl/t, which gives $713–718/t. We use the Brent-specific figure, because using the world average to price a Brent cargo overstates the tonnage you are buying.
Natural gas is converted at 52 MMBtu per tonne of LNG, which is an approximation that varies with composition; Henry Hub is also a US domestic benchmark and not what a cargo lands at in Asia or Europe. Uranium converts at 2,204.62 lb per tonne of U₃O₈, not of contained uranium metal — a distinction that changes the number by about 15%.
Metals, minerals and fertilizer inputs
| Commodity | Largest producer | % world production | Largest reserves | % world reserves | Price per tonne, Aug 2026 |
|---|---|---|---|---|---|
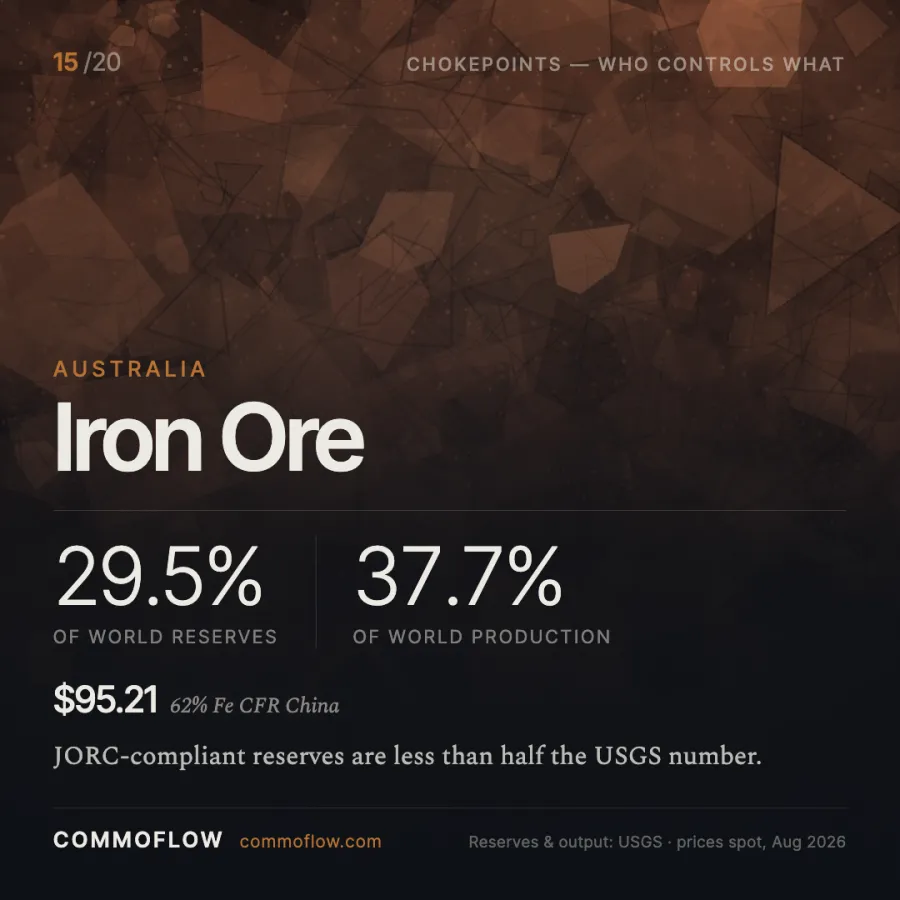
| Iron ore | Australia | 37.7% | Australia | 29.5% | $95.21/t |
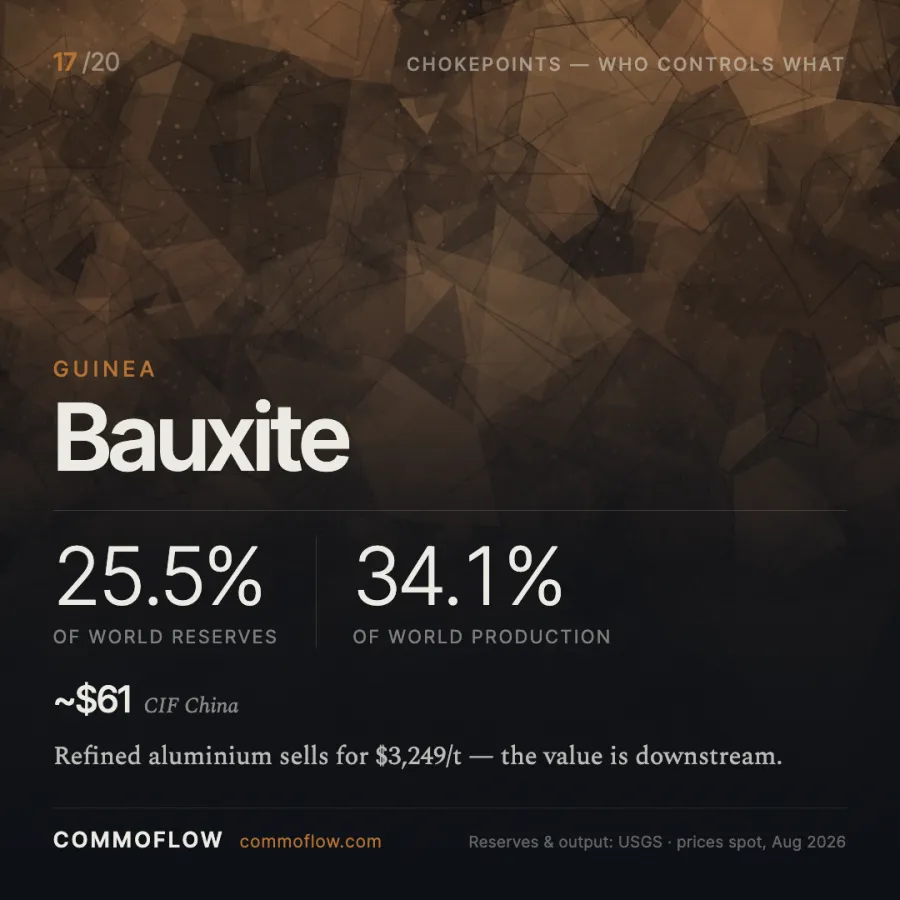
| Bauxite | Guinea | 34.1% | Guinea | 25.5% | $70–74/dmt CIF China |
| Aluminium (primary) | China | 60.8% | — | — | $3,248.75/t LME |
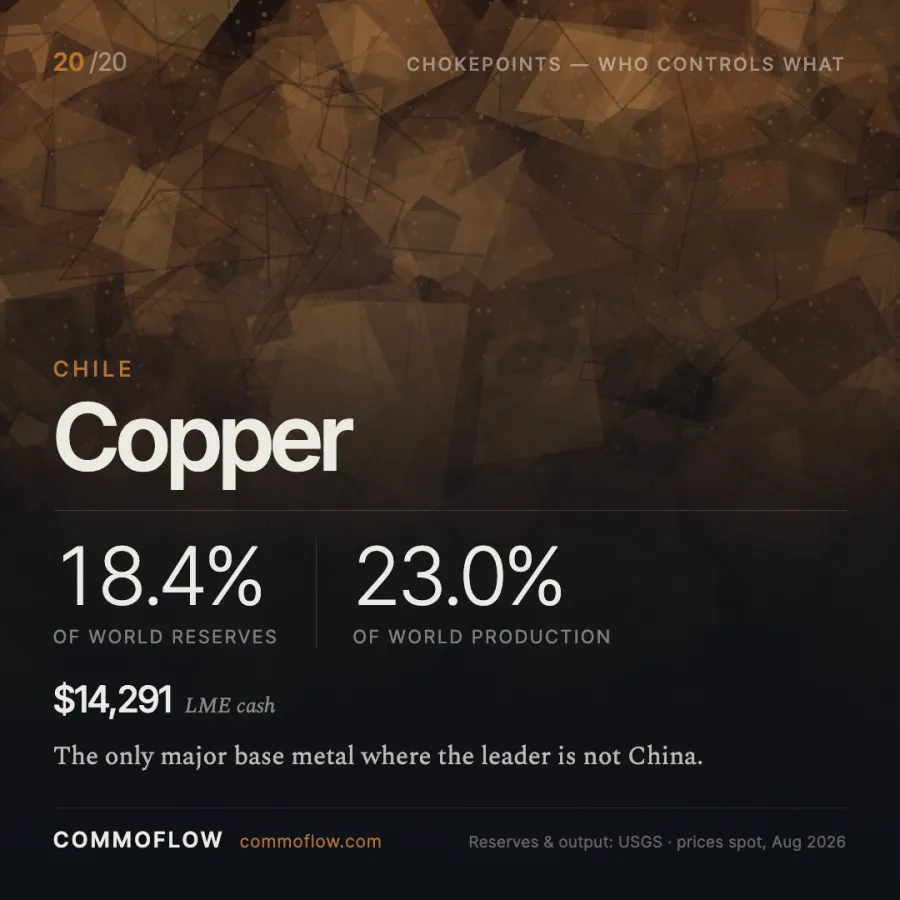
| Copper | Chile | 23.0% mine | Chile | 18.4% | $14,291/t LME cash |
| Gold | China | 11.5% | Australia | 19.7% | $4,587/oz → $147.5m/t |
| Silver | Mexico | 24.2% | Peru | 18.0% | $69.60/oz → $2.24m/t |
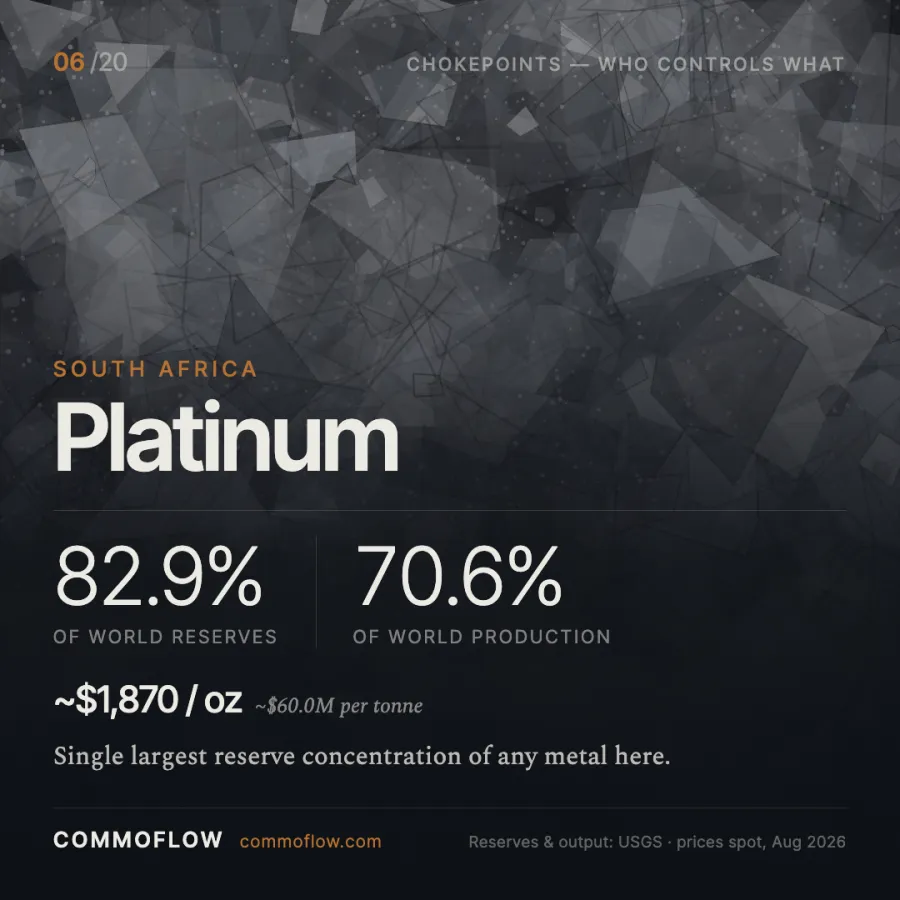
| Platinum | South Africa | 70.6% | South Africa | 82.9% (PGM) | ~$1,838/oz → $59.1m/t |
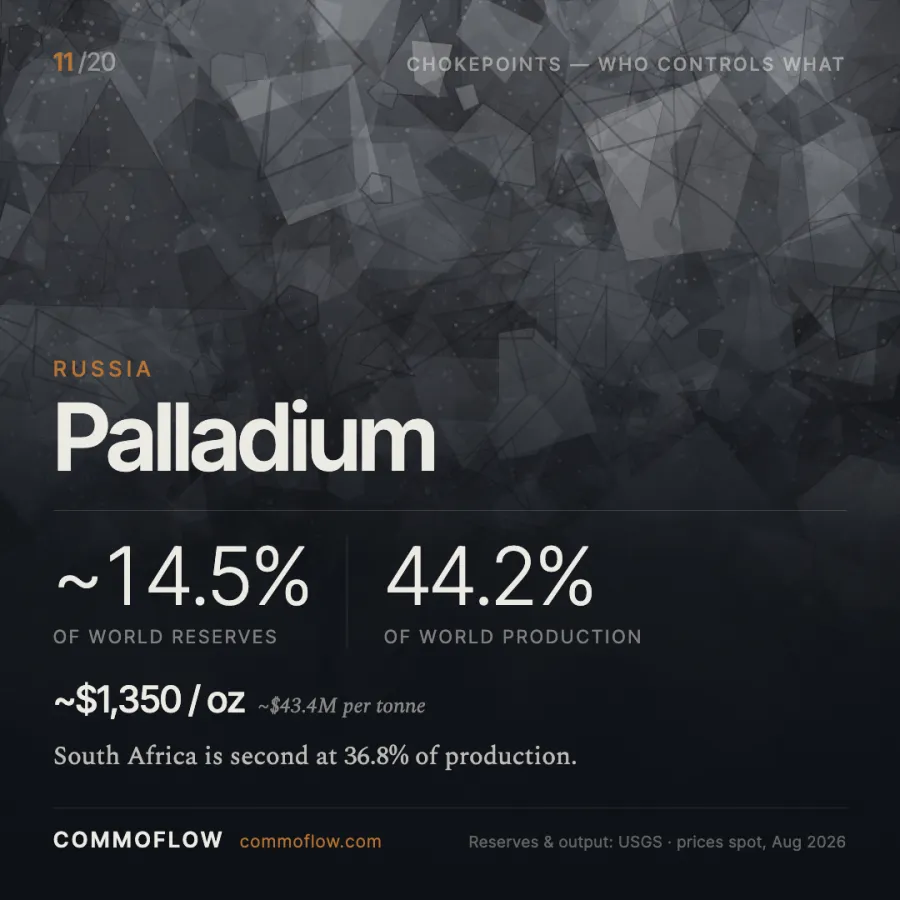
| Palladium | Russia | 44.2% | South Africa | 82.9% (PGM) | ~$1,340/oz → $43.1m/t |
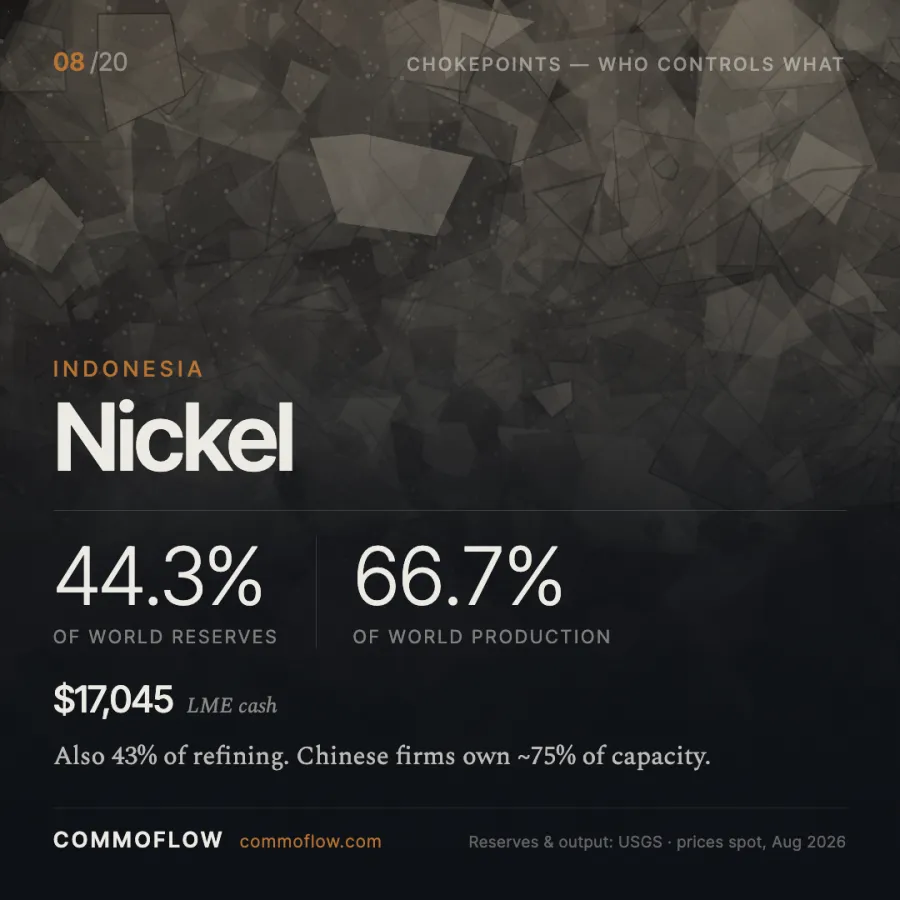
| Nickel | Indonesia | 66.7% | Indonesia | 44.3% | $17,045/t LME |
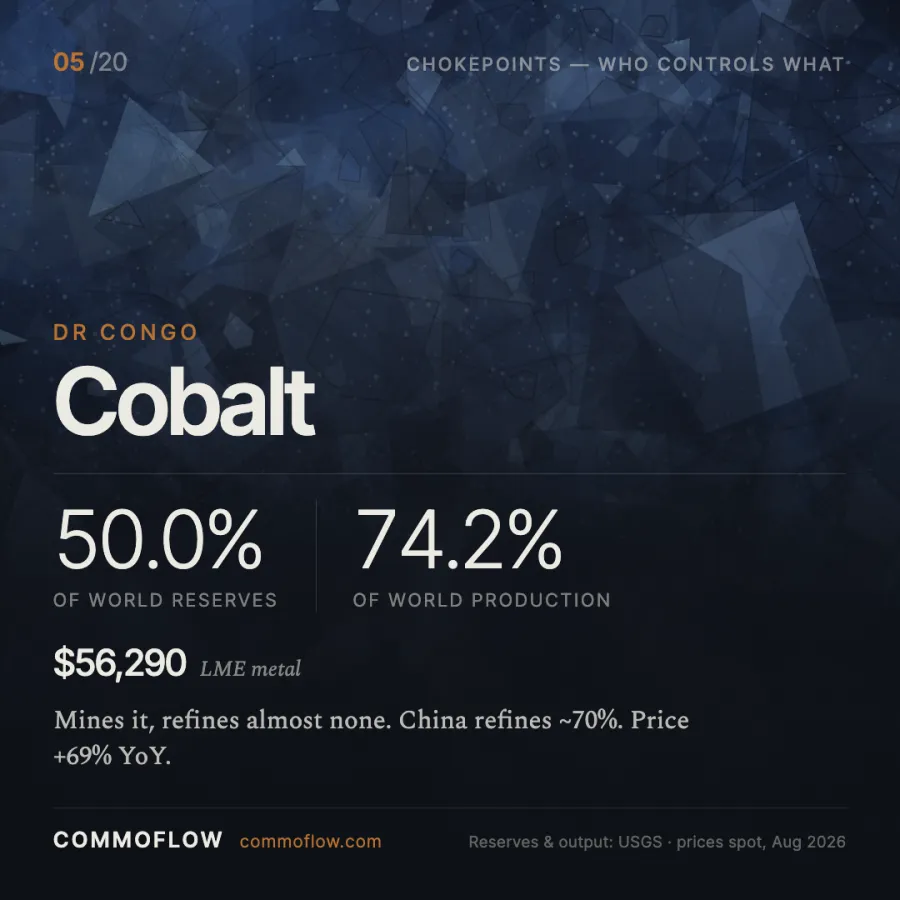
| Cobalt | DR Congo | 74.2% | DR Congo | 50.0% | $56,290/t |
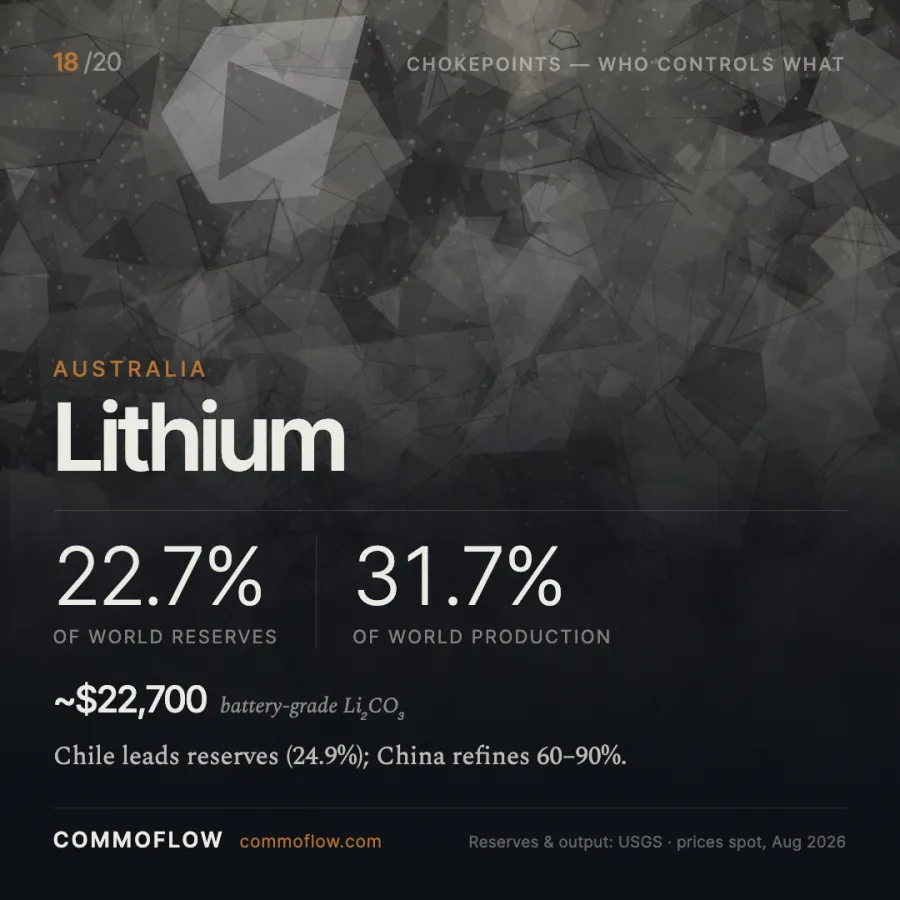
| Lithium | Australia | 31.7% | Chile | 24.9% | $22,656/t (Li₂CO₃ 99.5%) |
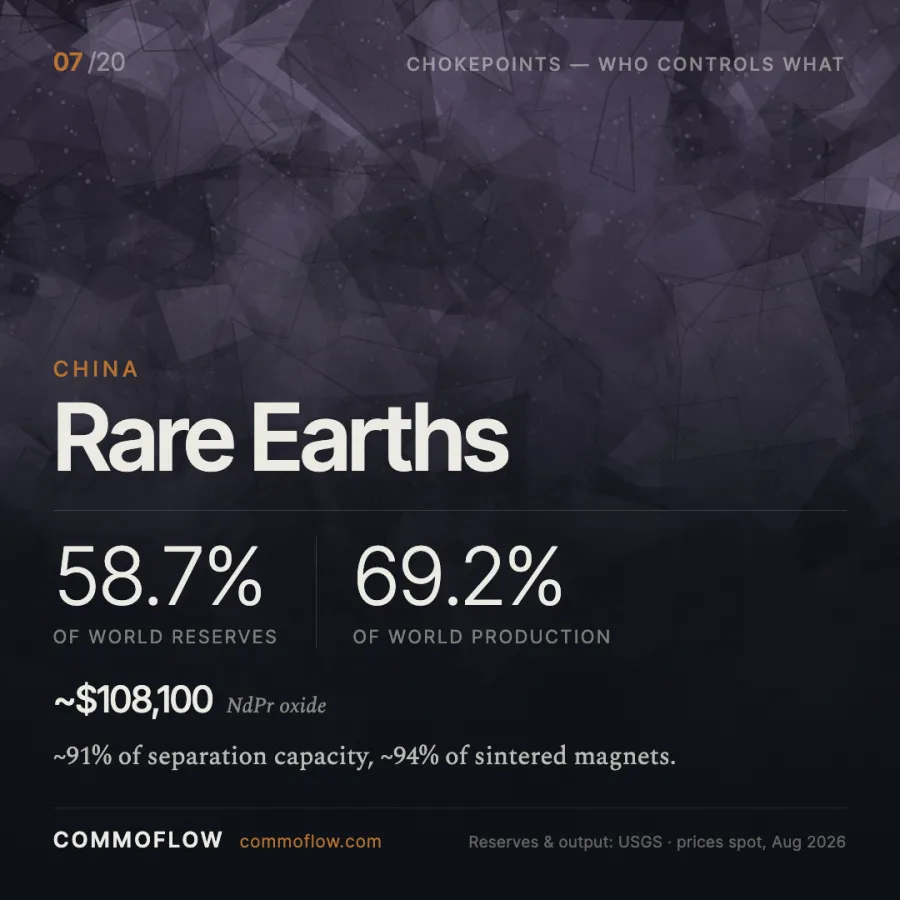
| Rare earths | China | 69.2% | China | 58.7% | $108,100/t NdPr ox. China; $95,000 ex-China |
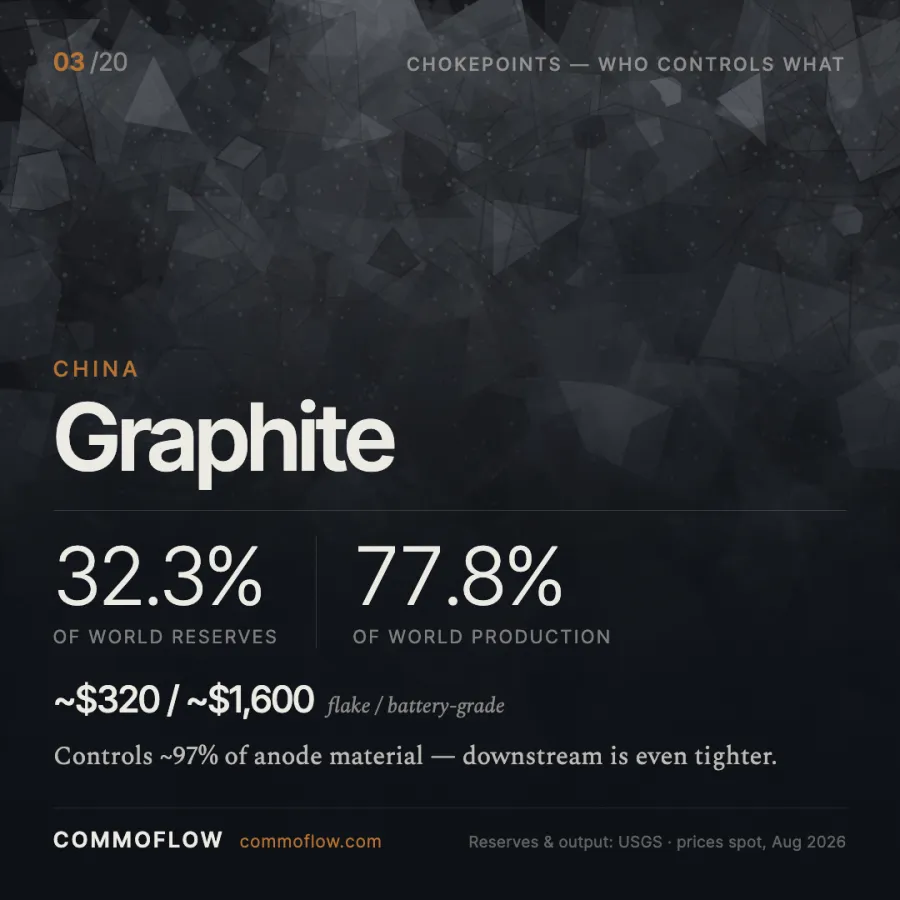
| Natural graphite | China | 77.8% | China | 32.3% | ~$320/t flake |
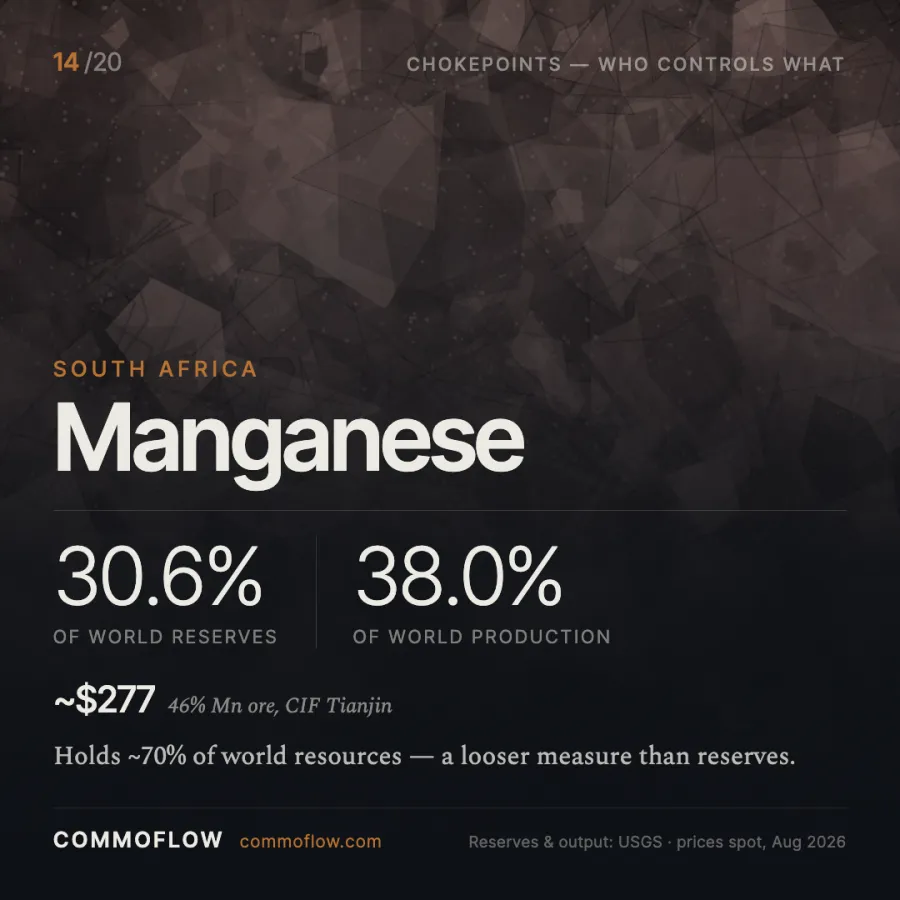
| Manganese | South Africa | 38.0% | Australia | 32.2% | ~$277/t ore |
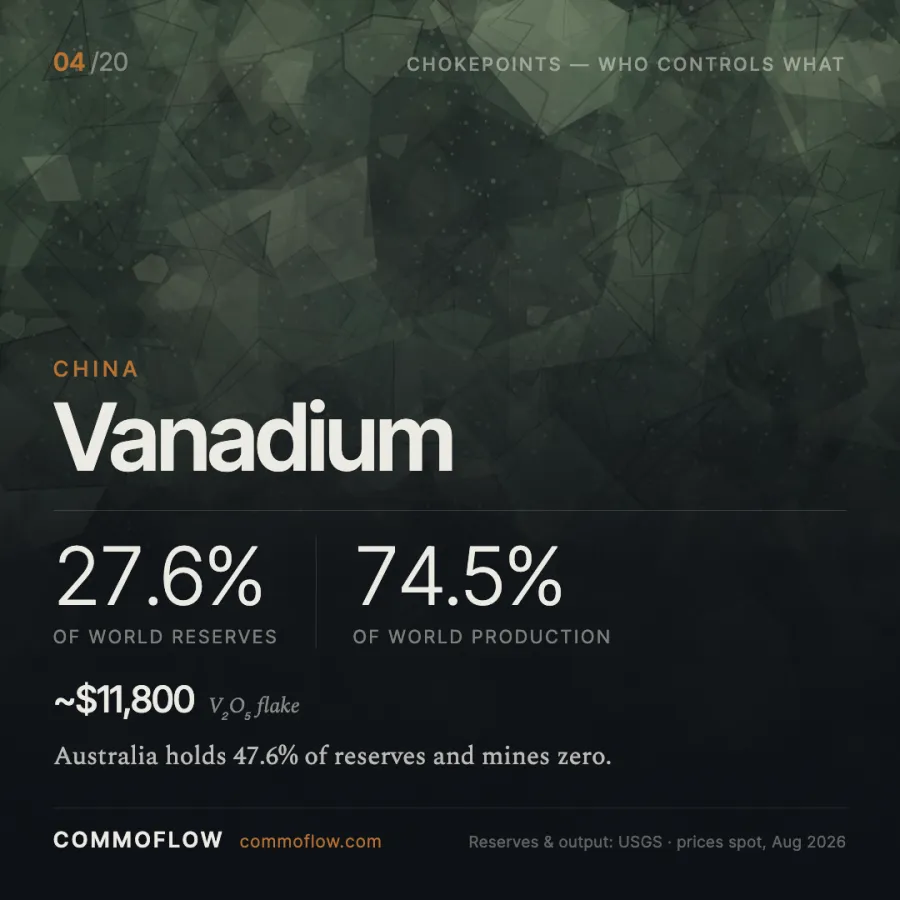
| Vanadium | China | 74.5% | Australia | 47.6% | ~$11,800/t |
| Titanium (ilmenite) | China | 34.0% | Australia | 34.7% | ~$260/t concentrate |
| Zinc | China | 31.5% | Australia | 26.7% | $3,823/t LME |
| Lead | China | 42.2% | Australia | 35.8% | $1,902/t LME |
| Tin | China | 24.5% | Indonesia | 23.3% | $55,900/t LME |
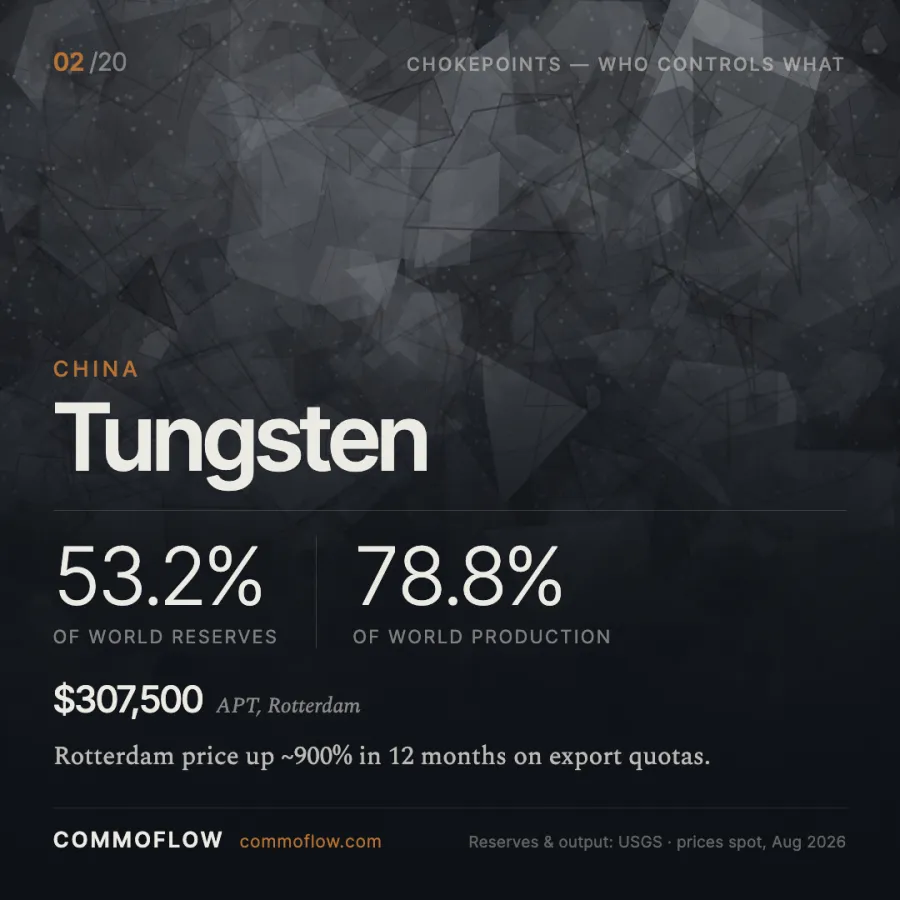
| Tungsten | China | 78.8% | China | 53.2% | $307,500/t APT |
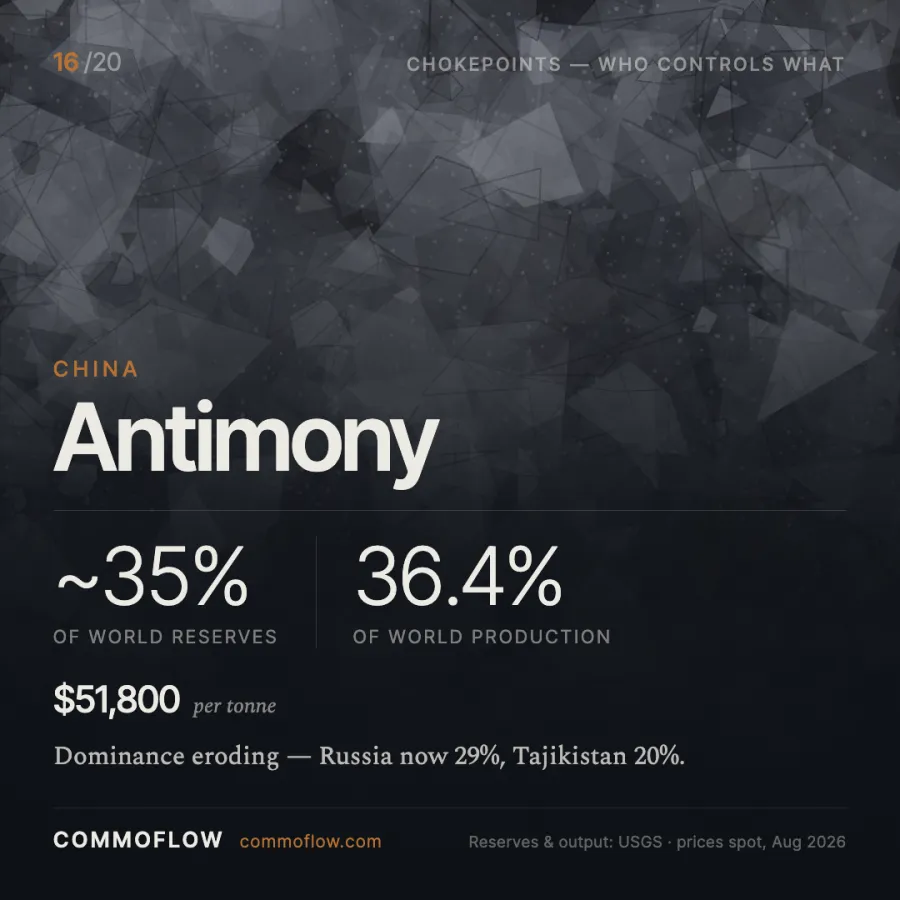
| Antimony | China | 36.4% | China | ~35% | $51,800/t |
| Molybdenum | China | 37.3% | China | 45.9% | $92,616/t |
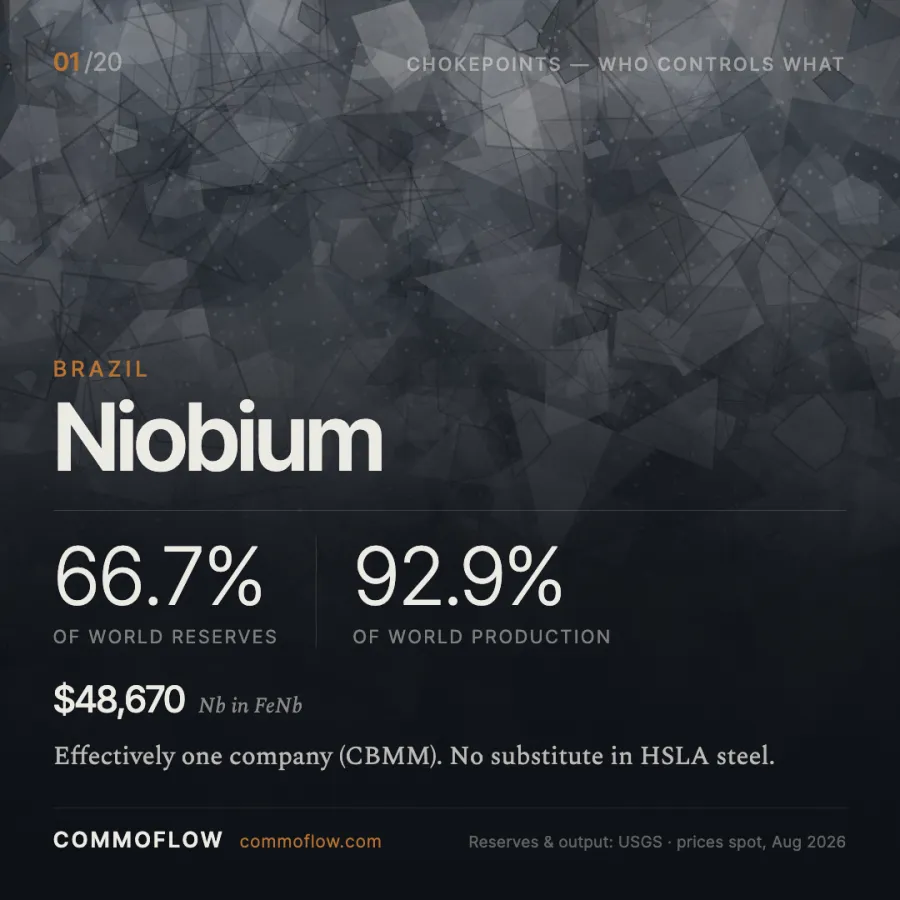
| Niobium | Brazil | 92.9% | Brazil | 66.7% | $48,670/t |
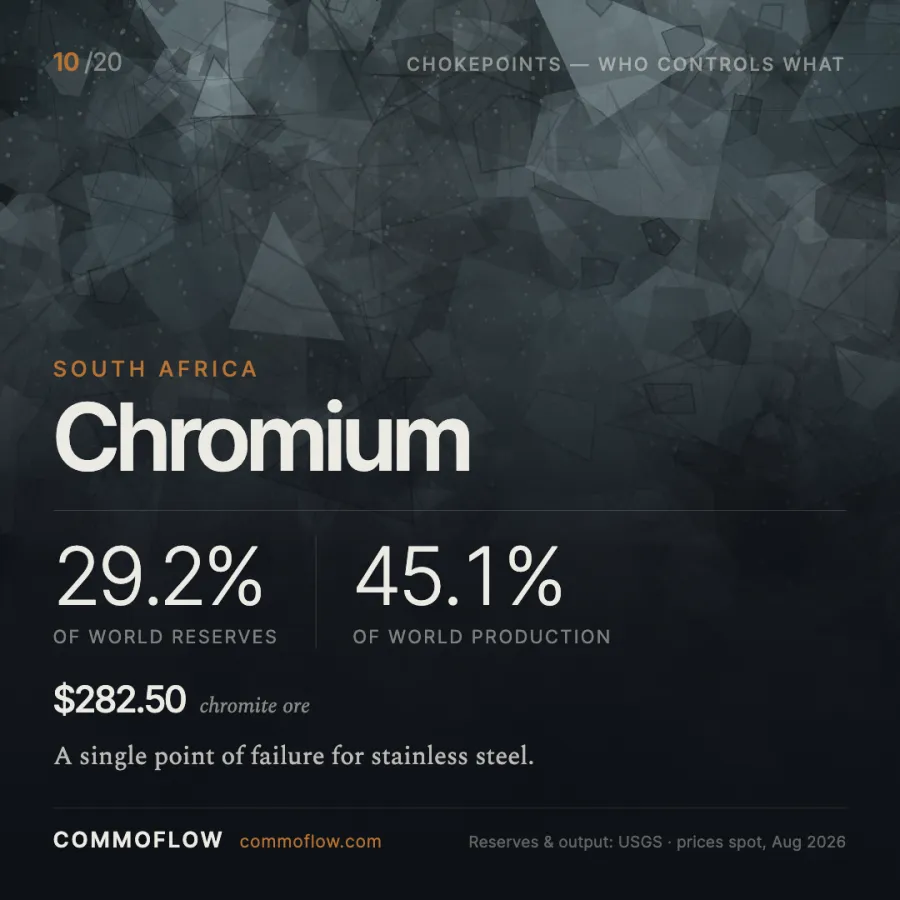
| Chromium | South Africa | 45.1% | South Africa | 29.2% (ore) | $282.50/t ore |
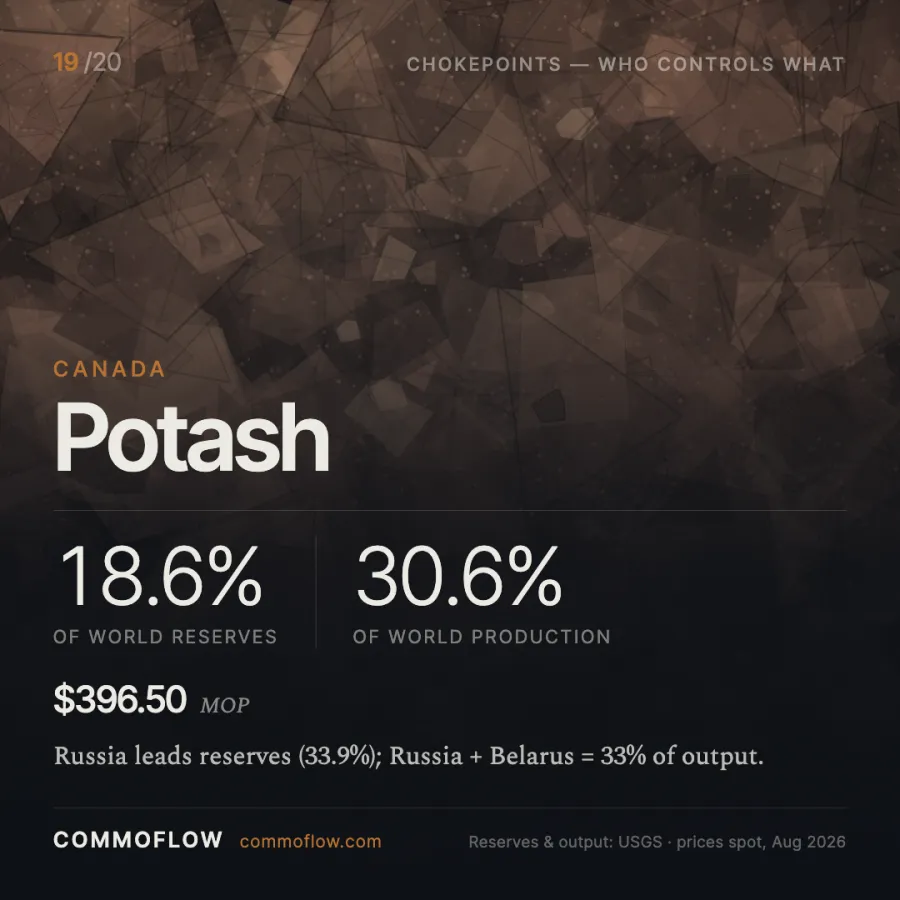
| Potash | Canada | 30.6% | Russia | 33.9% | $396.50/t MOP |
| Phosphate rock | China | 44.0% | Morocco | 68.5% | $170/t |
| Industrial diamond | Russia | 42.1% | Russia | 44.1% | ~$1.05m/t bort |
Where mining and refining come apart
This is the part of the table that does not show up in a production ranking, and it is usually the part that matters commercially.
- Cobalt. The DR Congo mines 74.2% of world supply. China refines the majority of it. A buyer exposed to Congolese mine risk and a buyer exposed to Chinese refining risk are exposed to two different things, and hedging one does nothing for the other. In February 2025 the DRC banned cobalt exports outright to address oversupply; by October that had become an annual quota of 96,600 tonnes of contained cobalt for 2026 and 2027.
- Copper. Chile mines 23.0% of the world’s copper. China operates 48.3% of world refining capacity while mining 7.8%. The smelter, not the mine, is the bottleneck most years.
- Nickel. Indonesia mines 66.7% — a position built in under a decade, and one that continues to grow while Australian mines went into care and maintenance through 2025 on low prices. Australian output fell an estimated 54% year on year.
- Aluminium. Guinea mines 34.1% of world bauxite and refines 360,000 tonnes of alumina — 0.24% of the world total. China mines 19.8% of bauxite, refines 62.0% of alumina and smelts 60.8% of primary aluminium. The ore leaves West Africa and the value is added in China.
- Rare earths. China’s 69.2% of mine production understates its position, because separation and metal-making are more concentrated than mining. NdPr oxide tells the story in two prices on the same day: CNY 726,500/t (about $108,100) inside China on 21 August 2026, and $95,000/t CIF Europe and North America. Ex-China material trading below the Chinese domestic price inverts the historical relationship, and it sits below the $110/kg floor in MP Materials’ agreement with the US Department of Defense — ex-China supply has arrived faster than ex-China demand.
The twenty largest production positions, ranked
Each card carries the country’s share of world production, its share of reserves and the current price per tonne. Ordered by production share, highest first.
The four genuine chokepoints
Concentration above roughly 70% from a single country is a different category of risk from concentration at 30%. Four commodities qualify on mine production alone:
- Niobium — Brazil, 92.9%. The most concentrated major commodity on earth, and the least discussed. Brazil also holds 66.7% of reserves, so the position is not going to erode.
- Tungsten — China, 78.8%, on 53.2% of reserves. Ammonium paratungstate at $307,500/t.
- Natural graphite — China, 77.8%, on only 32.3% of reserves. This is the gap most likely to close: Mozambique and Tanzania both roughly doubled output in 2025, to 60,000 t and 75,000 t respectively.
- Cobalt — DR Congo, 74.2%, on 50.0% of reserves.
South Africa’s platinum position — 70.6% of mine production on 82.9% of PGM reserves — belongs in the same conversation, and is more entrenched than any of them.
How to read these numbers
⚠️ Caveats that change the conclusions
- Reserves are an economic category, not a geological one. They are what is economically extractable at the time of assessment. A price move re-rates reserves without a single new discovery.
- Reporting standards are not comparable across countries. The USGS tabulates Australia on a broad economic-demonstrated-resources basis rather than JORC. Where both exist the gap is severe — Australian gold reserves are 13,000 t on the USGS basis and 4,500 t JORC-compliant.
- Several world totals are floors, not values. USGS reports rare earths as “>75,000,000” tonnes, tin as “>6,000,000” and antimony as “>2,000,000”. Percentage shares computed against them are upper bounds.
- Venezuela’s oil reserves are a definitional artefact. The 303.7 Gbbl figure counts Orinoco extra-heavy crude that requires upgrading; independent estimates of economically recoverable volumes run near 29 Gbbl.
- “Industrial diamond” is not “diamond”. The USGS world total of 38 million carats covers natural industrial stones only. Against all natural rough production, Russia’s share is 31.9%, not 42.1%.
- Units differ by commodity. Lithium is reported as contained lithium, not carbonate equivalent; multiply by 5.323 for LCE. Manganese, chromium and iron ore shares depend on whether you count ore or contained metal.
What this means if you are buying
Three practical consequences follow from the table.
Country risk is not the same as supply risk. For cobalt, graphite, rare earths and aluminium, the exposure that will actually interrupt your material is downstream of the mine. Diversifying mine origin while every tonne still routes through the same processing country is not diversification.
The high-concentration positions move on policy, not geology. The DRC’s cobalt quota, China’s export licensing on graphite and rare earths, and Indonesia’s ore export bans all repriced their markets faster than any mine outage. Watch the ministries, not the drill results.
Reserve leadership tells you where the next decade’s supply can come from, not where it will. Australia holds the largest reserves of vanadium and produces none of it. That is a standing invitation and a standing warning at the same time, and which one it is depends entirely on why the deposit has not been developed.
CommoFlow sources, buys, sells and ships across most of the materials in this table, from the Middle East, Central Asia, the Caucasus, Africa and Australia. If you are looking at a specific origin or want a view on a particular route, talk to our desk.
Frequently asked questions
Which country produces the most commodities overall?
China leads world mine production in 13 of the 31 commodities in this table — graphite, rare earths, tungsten, vanadium, lead, zinc, tin, antimony, molybdenum, phosphate rock, titanium mineral concentrates, coal and gold — and leads refining or smelting for aluminium, alumina, copper and cobalt on top of that. No other country leads more than three.
What is the difference between reserves and resources?
Reserves are the portion of a resource that is economically extractable under conditions at the time of assessment. Resources are everything identified, economic or not. Bolivia is the standard illustration: it holds roughly 23 million tonnes of lithium resources and zero USGS-tabulated reserves.
Why do commodity prices per tonne vary so much?
Because the tonne is a unit of mass, not of value density. Phosphate rock at $170/t and gold at $147.5 million/t are both priced correctly — one is a bulk mineral moved in Panamaxes, the other is refined metal moved in a briefcase. Comparing them is only useful for understanding what freight can and cannot justify.
Which commodity is most concentrated in one country?
Niobium. Brazil produced 104,000 of the world’s 112,000 tonnes in 2025 — 92.9% — and holds 66.7% of reserves. It is the most concentrated significant commodity in world trade, and unlike the others in that bracket it attracts almost no policy attention.
Sources
- USGS Mineral Commodity Summaries 2026 — reserves and 2025 estimated production, published February 2026
- OPEC Annual Statistical Bulletin 2026 — proven crude oil reserves, end-2025
- US Energy Information Administration Short-Term Energy Outlook — oil and gas production
- Westmetall / LME cash settlements — copper, tin, zinc, lead, nickel, aluminium, 21 August 2026
- Shanghai Metals Market and Fastmarkets — lithium carbonate, bauxite, graphite, manganese, antimony, ilmenite assessments
- Benchmark Mineral Intelligence and S&P Global — NdPr oxide, 18–21 August 2026
- World Bank Pink Sheet, August 2026 — phosphate rock, potash, iron ore
- Kimberley Process 2025 — total rough diamond production
Have a commodity requirement? Get in touch.